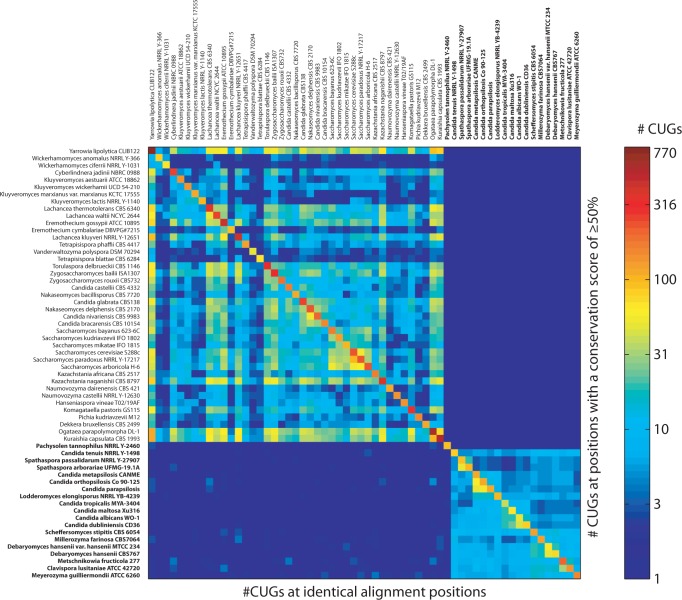
Fig. 5.—
CUG codon positions conserved between species. The heatmap represents the number of CUG codon positions shared between every two species. The upper triangle shows the number of shared CUG codon positions at those positions in the concatenated alignment of the full-length sequences, which have a conservation score of at least 50%, the lower triangle the number of shared CUG codons at all alignment positions. The diagonal represents the total number of CUG codons in the respective species. The number of CUG codons is colored on a logarithmic scale. Species encoding CUG as serine are typed in bold.

