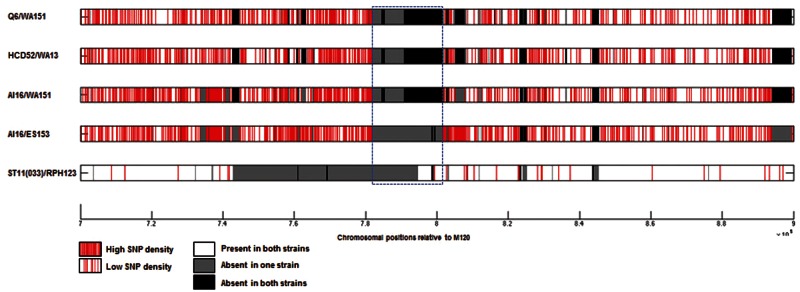
Fig. 6.—
Investigation of mechanisms of PaLoc acquisition and modification post acquisition using SNP plots. The distribution of polymorphisms between five different pairs of strains is shown for the genomic region containing the PaLoc relative to the reference strain M120. The PaLoc region is indicated by the blue dashed box. Each row represents a pairwise comparison, and individual polymorphisms are shown in red.

