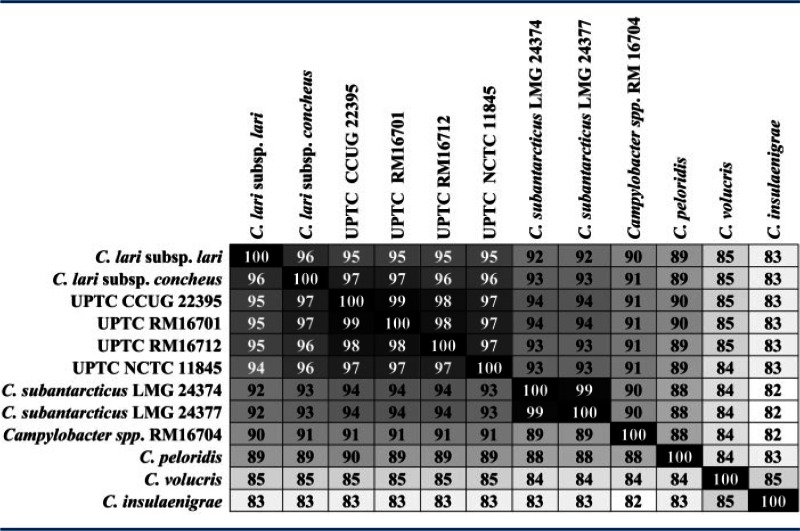
Table 3.
Average Amino Acid Identities of the Campylobacter lari Group Core Proteome
 |
Note.—To more easily visualize amino acid similarities of the proteomes, we utilized a gradient heat map with black = 100%.
Average Amino Acid Identities of the Campylobacter lari Group Core Proteome
 |
Note.—To more easily visualize amino acid similarities of the proteomes, we utilized a gradient heat map with black = 100%.