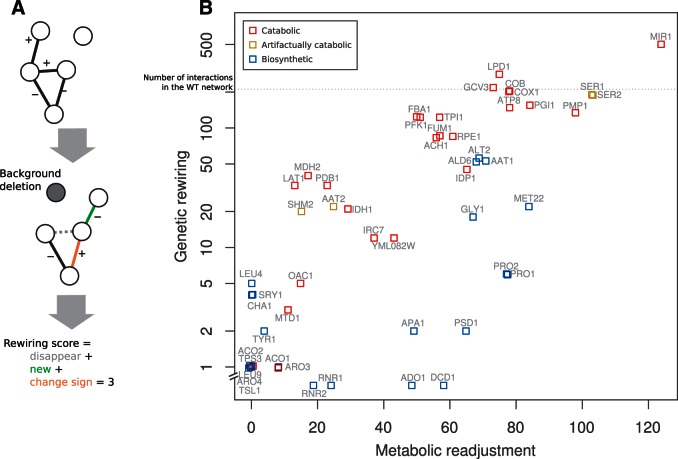
Fig. 1.—
Genetic rewiring correlates with the underlying metabolic readjustment. (A) Cartoon that illustrates the kind of alterations in the genetic network that contributes to the rewiring score: new interactions + interactions that changed sign + disappeared links (excluding those of the gene acting as background). (B) Association between genetic rewiring and metabolic readjustment (as number of reactions that modified their relative flux) in response to deletions in active genes, that is, backgrounds; there exists 207 interactions in the WT network, we show this number as a dashed line to give a reference for the amount of rewiring. There are as well 277 active fluxes in the corresponding metabolism (coordinates incorporate some noise to help visualization, and the y axis logarithmic scale is broken to locate backgrounds with no genetic rewiring). Note that catabolic genes exhibit much stronger rewiring than biosynthetic ones, regardless of the strength of metabolic readjustment (some genes are artifactually catabolic in the model, see supplementary material, Supplementary Material online).

