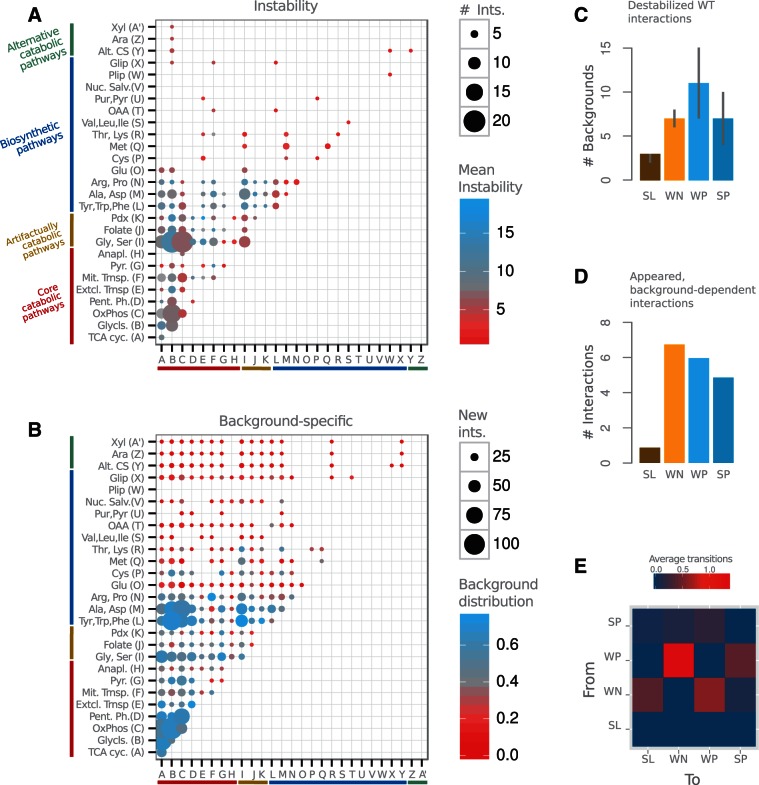
Fig. 2.—
Catabolic and biosynthetic modules exhibit distinctive genetic rewiring. (A) Number of interactions of the WT network between the corresponding metabolic annotation modules (dot size) and associated average instability (dot color; measured for each interaction as the number of backgrounds where it disappears, changes sign, or strength). Catabolic modules show higher instability than biosynthetic ones. (B) New interactions (i.e., absent in WT network) between modules (dot size) and their distribution among backgrounds (dot color; distribution quantified as normalized Shannon entropy, see Materials and Methods). Catabolic modules are characterized by the emergence of many new interactions in different backgrounds. Fewer new interactions appear among biosynthetic modules, these being generally more background specific. (C) Instability of interactions, measured as the number of backgrounds in which they disappear, as a function of sign and strength (median with upper and lower quartiles). Weak interactions are more unstable than strong ones of the same sign, and positive interactions are more unstable than negative. (D) Average number of new interactions appearing in each background as a function of strength and sign. WN interactions appear dominant on average. (E) Expected number of transitions between interaction types in an average background. WP to WN conversions are the most recurrent ones. Interaction classes are SL, WN, WP, and SP, see Materials and Methods.

