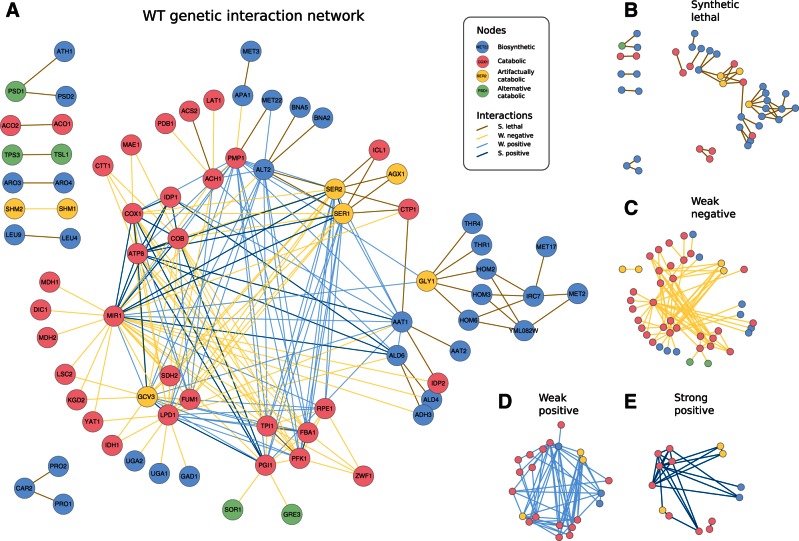
Fig. 3.—
The topology of the WT genetic network reflects the intertwined organization of catabolism. (A) WT genetic network with nodes colored by function and interactions by class. (B–E) Decomposition of the network into the four interaction classes. Note the association between these types and metabolic function (i.e., SL links broadly corresponding to biosynthetic genes and the rest—WN, WP, and SP—to catabolic) that we additionally corroborated with experimental data of epistasis between metabolic gene pairs Szappanos et al. 2011 (supplementary fig. S24, Supplementary Material online). The distribution of weak interactions emphasizes the intertwined organization of the catabolic core (some genes appear as artifactually catabolic in the model, see discussion in supplementary material, Supplementary Material online). Moreover, SL links appear in the “periphery” of this core (full details of each SL cluster in supplementary figs. S27–S33, Supplementary Material online).

