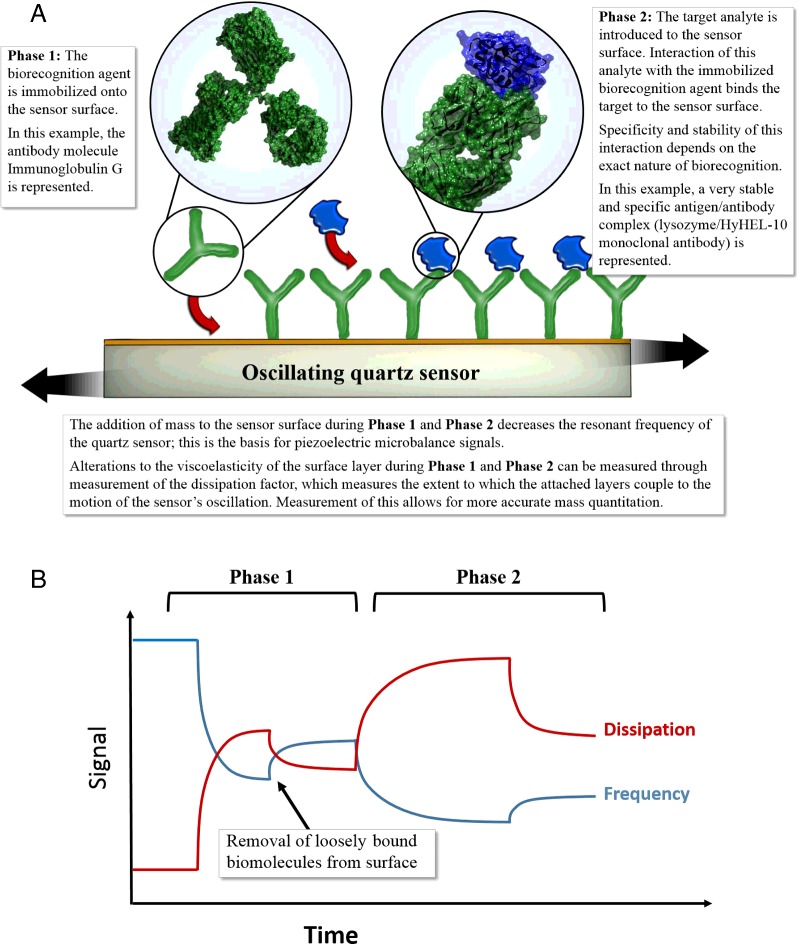
Figure 2. (A) Schematic depiction of antibody immobilization (Phase 1) on to the surface of a quartz sensor followed by the introduction of the target analyte (Phase 2). (B) Depiction of frequency against dissipation plots may be observed in QCM-D experiments.
In Phase 1, frequency decreases due to loading of the antibody on to the surface, while increased dissipation is recorded, due to the viscoelastic nature of the antibody. After a period, loosely bound antibody is removed, resulting in a slight increase in frequency as mass is lost or as coupled water is lost. In the second phase, the target analyte is introduced, resulting in a frequency decrease and dissipation increase as it binds to the antibody immobilized during Phase 1. PDB accession codes in (A): 1IGT [10] for the antibody and 3HFM [11] for the analyte.

