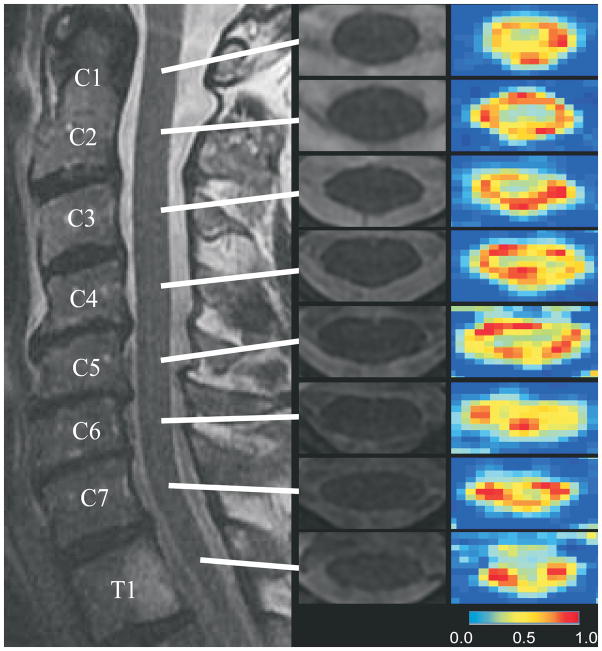
Figure 4.
Axial fractional anisotropy (FA) maps and T2-weighted images at individual levels of the cervical spinal cord in a healthy subject. Images were obtained using a standard 1.5 T clinical MR scanner. FA maps show higher anisotropy in the white matter funiculi and lower anisotropy in the central gray matter. (from 59, published with permission from Journal of Magnetic Resonance Imaging, John Wiley & Sons Inc.)

