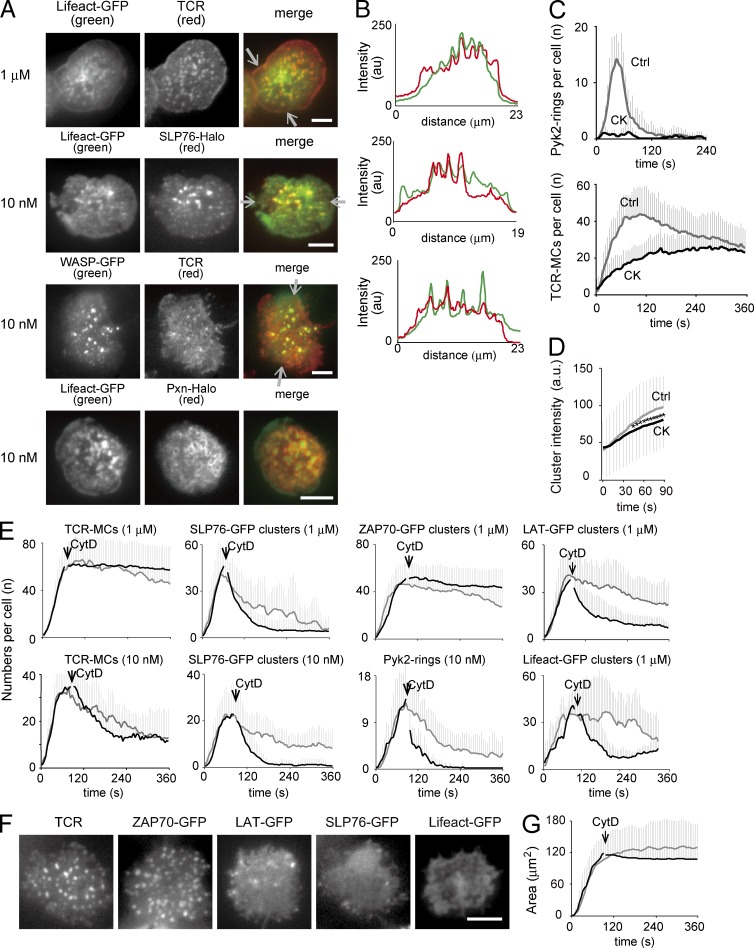
Figure 5.
Dependency of synapse-like structures on F-actin. (A) T cells expressing Lifeact-GFP, Lifeact-GFP and SLP76-Halo, WASP-GFP, or Lifeact-GFP and Pxn-Halo were examined with 1 µM or 10 nM Ag. Representative images of 8–32 cells are shown. (B) The fluorescence intensity profiles of Lifeact-GFP (green) and TCR (red; top), Lifeact-GFP (green) and SLP76-Halo (red; middle), and WASP-GFP (green) and TCR (red; bottom) in between each pair of white arrows in A are plotted. (C) T cells expressing Pyk2-GFP were pretreated with 30 µM CK666 for 30 min and examined. The numbers of Pyk2 rings and TCR-MCs with (black line) and without (gray line) CK666 treatment are plotted per time. Data are the mean from 14 or 16 cells ± SD. Ctrl, control. (D) The mean intensities of individual TCR clusters generated during the initial 1 min in F are plotted. Data are the mean from 1,309–1,994 clusters ± SD. *, P < 0.01. (E) When the T cells expressing Pyk2-GFP, SLP76-GFP, ZAP70-GFP, LAT-GFP, or Lifeact-GFP had expanded on the planar bilayers with 10 nM or 1 µM Ag, CytD was added at a final concentration of 10 µM. The numbers of rings or clusters for each molecule with (black line) and without (gray line) CytD treatment are plotted per time. Arrows indicate the kinetics of CytD addition. Data are the mean from 12–18 cells ± SD. (F) Representative images of TCR, ZAP70-GFP, LAT-GFP, SLP76-GFP, and Lifeact-GFP at 90 s after the addition of CytD are shown. (G) The mean contact area with and without CytD treatment is plotted over time. Data are the mean from 16 cells ± SD. a.u., arbitrary units. Bars, 5 µm.

