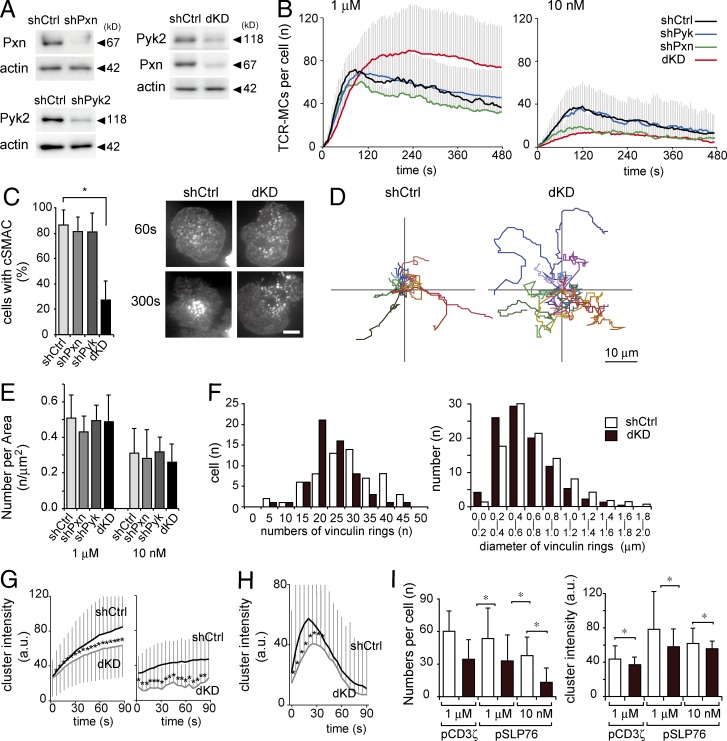
Figure 7.
Critical role of the micro–adhesion ring for TCR-MC development. (A–I) T cells transduced with shCtrl, shPxn, shPyk2, or shPxn + shPyk2 (dKD) were examined on the planer bilayer. (A) The expression levels of Pxn and Pyk2 with shCtrl, shPxn, shPyk2, or dKD cells were examined by Western blotting. Representative data from three independent experiments are shown. (B) The numbers of TCR-MCs per cell in shCtrl, shPxn, shPyk2, or dKD cells on 1 µM or 10 nM Ag are plotted. Data are the mean from 18–38 cells ± SD. (C) The rates of cells with cSMACs at 10 min on 1 µM Ag–loaded bilayer were plotted (left). Data are the mean from 87–132 cells ± SD. Representative images are shown (right). Bar, 5 µm. (D) The trajectories of movements of shCtrl or dKD cells on 1 µM Ag for 10 min are shown. 16 cells for each condition were analyzed. (E) The concentrations of TCR-MCs in the cells analyzed in B are plotted. Data are the mean from 18–38 cells ± SD. (F) The shCtrl or dKD cells were fixed at 1.5 min and stained with anti-vinculin–FITC mAb. Histograms of the numbers of vinculin rings per cell and the diameters of each ring in shCtrl and dKD cells are shown. Data are from 24 cells for each condition. (G) The mean intensities of individual TCR-MCs in the cells in B are plotted over time. Data are the mean from 526–1,774 clusters ± SD. a.u., arbitrary units. (H) The intensities of individual Lifeact-GFP clusters in shCtrl and dKD cells with 1 µM Ag are shown. Data are the mean of 641 and 635 clusters ± SD, respectively. (I) The mean number of clusters per cell and individual intensities of phospho–CD3-ζ clusters and phospho-SLP76 (pSLP76) clusters in shCtrl (unshaded bars) or dKD (shaded bars) cells is depicted. Data are the mean from 1,098–1,438 clusters ± SD. *, P < 0.01.

