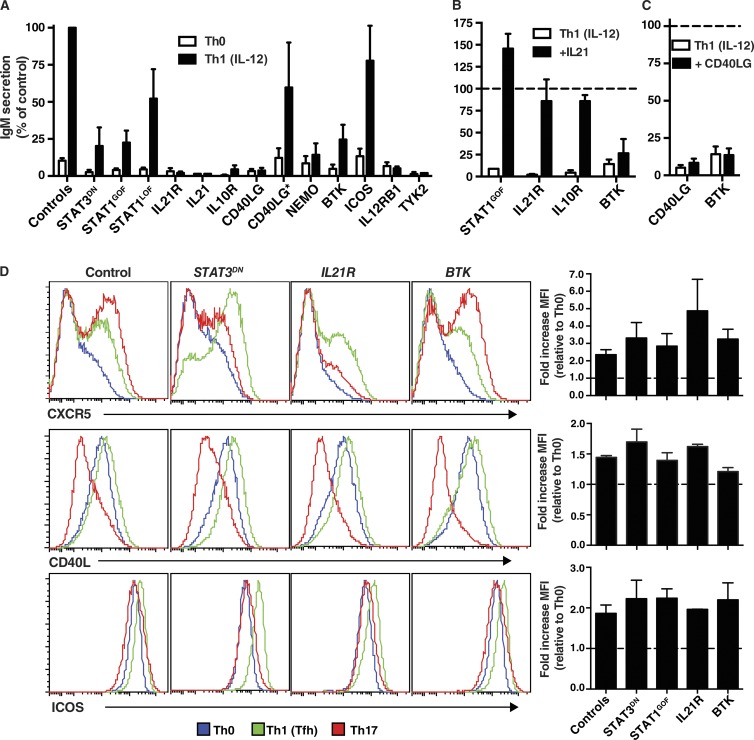
Figure 8.
Impaired Tfh function of naive CD4+ T cells caused by mutations affecting IL-21/STAT3 signaling or cognate T–B cell interactions. (A) Naive CD4+ T cells from healthy controls or PID patients cultured under Th0 or Th1 conditions that induce a Tfh phenotype for 5 d were then treated with mitomycin C and co-cultured with sort-purified normal allogeneic naive B cells in the presence of TAE beads. Secretion of IgM was determined after 7 d; values are expressed as IgM secretion (mean ± SEM) as a percentage of the response induced by normal naive CD4+ T cells assessed concurrently. Controls, n = 33; STAT3DN, n = 6; STAT1GOF, n = 8; STAT1LOF, n = 4; IL21R, n = 5; IL21, n = 1; IL10R, n = 2; CD40LG, n = 5; CD40LG*, n = 3; NEMO, n = 3; BTK, n = 7; ICOS, n = 4; IL12RB1, n = 4; TYK2, n = 1. (B and C) Co-cultures described in A were supplemented with exogenous IL-21 (B) or CD40L (C) on day 0; IgM secretion was determined after 7 d. The dotted line indicates the relative response (mean ± SEM) of control naive CD4+ T cells (normalized to 100%). (D) Naive CD4+ T cells from healthy controls or patients with STAT3DN, IL21R, or BTK LOF mutations or STAT1 GOF mutations were cultured under Th0, Th1/Tfh, or Th17 conditions. After 3 d, the cells were harvested, and expression of CXCR5, CD40L, or ICOS was determined by flow cytometry. The histogram plots depict expression of the indicated surface receptor on cells cultured under Th0 (blue), Th1/Tfh (green), or Th17 (red) conditions. The graphs represent fold change (mean ± SEM) in expression of the indicated cell surface marker normalized to the Th0 culture (dashed line). Controls, n = 5; STAT3LOF, n = 3; STAT1GOF, n = 2; IL21R, n = 2; BTK, n = 3.

