Figure 1.
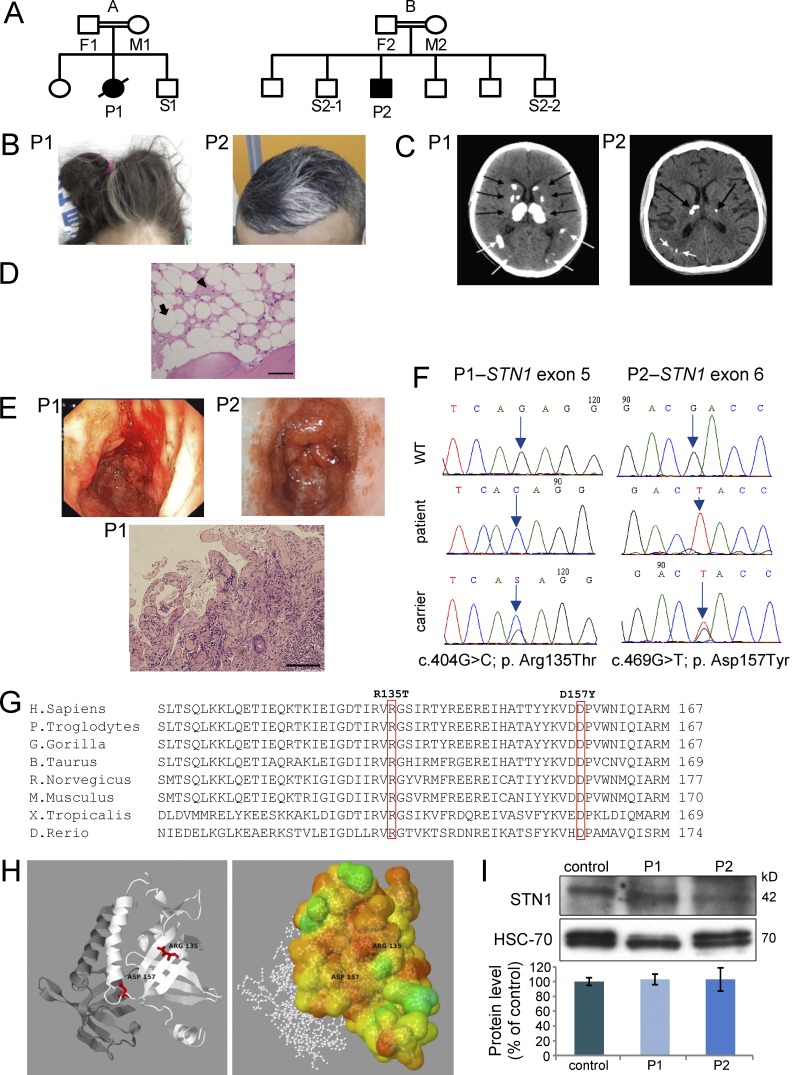
Genetics and clinical phenotypes of STN1-mutated patients. (A) Family pedigrees of the affected families (A and B). Solid symbols represent the affected subjects P1 and P2, and open symbols represent unaffected relatives. Squares indicate male subjects, and circles female subjects. A slash indicates a deceased subject. (B) Graying hair. (C) Multiple calcifications (arrows) in brain computerized tomography (CT). (D) Bone marrow trephine biopsy of patient P2. The marrow spaces consist primarily of adipose tissue (white areas; example marked with an arrow) and edematous stroma (pink areas; example marked with an arrowhead). Bar, 20 µm. (E) Endoscopy images are noted in both patients (top). Intestine biopsy of patient P1 (bottom). Images are magnified x600. Size bar – Bar, 20 µm. (F) Dideoxy Sanger sequencing was performed to the different STN1 genotypes detected in the studied pedigrees. (G) Alignment analysis using the NCBI HomoloGene tool was performed. The mutated residues R135 (P1) and D157 (P2) are boxed. The aligned vertebrate orthologues from top to bottom are: human, chimpanzee, gorilla, cow, rat, mouse, frog, and zebrafish. (H) Crystal structures of wild-type hSTN1 in complex with TEN1, but without hCTC1 were available in the PDB (4joi; Bryan et al., 2013). (left) A schematic cartoon view of the STN1 (white) and TEN1 (gray) complex with the position of the two mutations highlighted in red. (right) STN1 molecule is colored according to conservation scores of Consurf (Ashkenazy et al., 2010). 2D images were created based on PDBsum (Laskowski, 2001) images. 3D images were created using Jmol. (I) Western blot analysis to STN1 and to heat shock cognate protein 70 (HSC-70) was performed on PBL samples from the patients and healthy control, followed by densitometry using the ImageJ software. STN1 protein level in the control sample was set to 100%. Data represents three repeated analyses.

