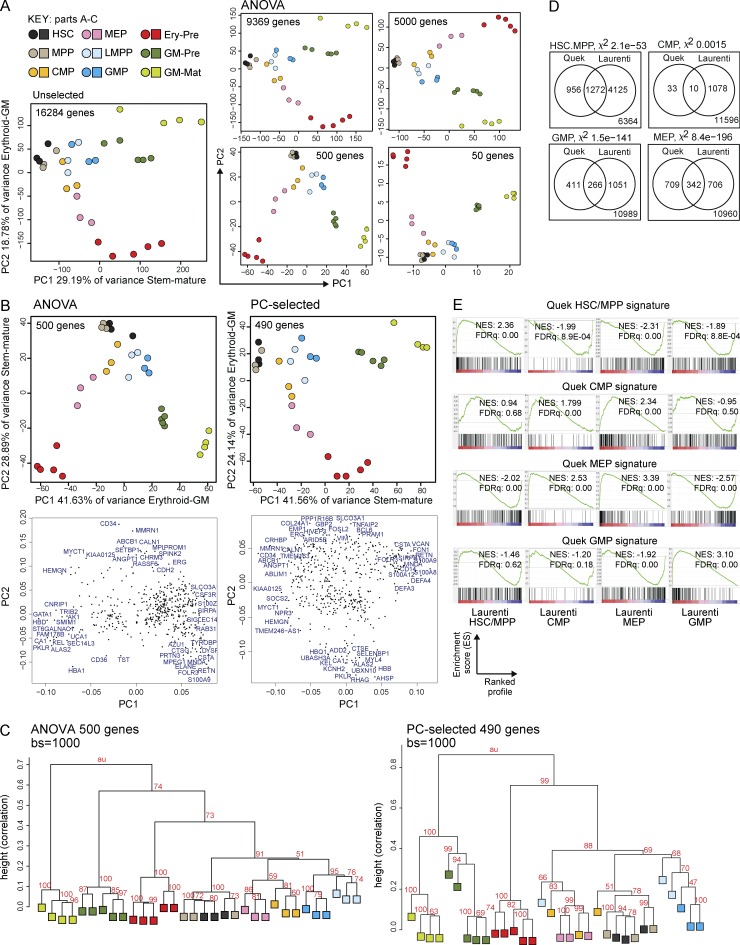
Figure 4.
Gene expression of normal HSPC/precursor/mature populations by RNA-seq defines stem–mature and erythroid–GM differentiation axes in unbiased and selected gene sets. (A) PCA plots showing the position of different normal Lin−CD34+ HSPC (n = 3 donors), GM-pre (CD34−117+244+; n = 5 donors), GM-mat (CD34−117−244+; n = 4 donors), and erythroid precursor (Ery-pre; CD34−117+244−; n = 5 donors) populations using different numbers of genes: either all expressed genes (left), ANOVA-selected genes differentially expressed between the normal populations (P < 0.05), or 5,000, 500, or 50 top differentially expressed genes (ranked by ANOVA p-value). The percentage of variance represented by each PC is shown. (B) A comparison of the ANOVA 500 gene set with the PC-selected 490 gene set by two-dimensional PCA. The stem–mature and GM–erythroid axes represented by the PCs are shown together with percentage of variance. Loadings plots are shown directly below the corresponding PCA, showing a selection of genes with the most extreme loadings scores in each PC. (C) Hierarchical clustering of ANOVA 500 and PC-selected 490 gene sets using 1,000 bootstrap (bs) permutation analyses. au = approximate unbiased p-values, which indicate the probability that the cluster is supported by the data. 100 = 100% probability that the cluster is correct. Height values measure dissimilarity expressed as (1 − [correlation coefficient]). Correlation coefficient of 1 = complete correlation. (D) Validation of gene expression signatures from our data for HSCs/MPPs, GMPs, common myeloid progenitors (CMPs), and megakaryocyte-erythroid progenitors (MEPs) with the signatures from a recent publication (Laurenti et al., 2013). In each Venn diagram, the number of genes in our signature (Quek) shared with those from Laurenti et al. (2013) are shown together with the total number of expressed genes in the two gene sets (bottom right corner). The likelihood of having shared genes expressed in both datasets out of total expressed genes is estimated using a χ2 test (χ-value p-value is indicated). (E) GSEA plots showing the enrichment of our HSC/MPP, common myeloid progenitor, megakaryocyte-erythroid progenitor, and GMP signatures against profiles of expressed genes in the indicated populations using published data (Laurenti et al., 2013). Normalized enrichment scores (NES) and FDR q-values (FDRq) are shown.

