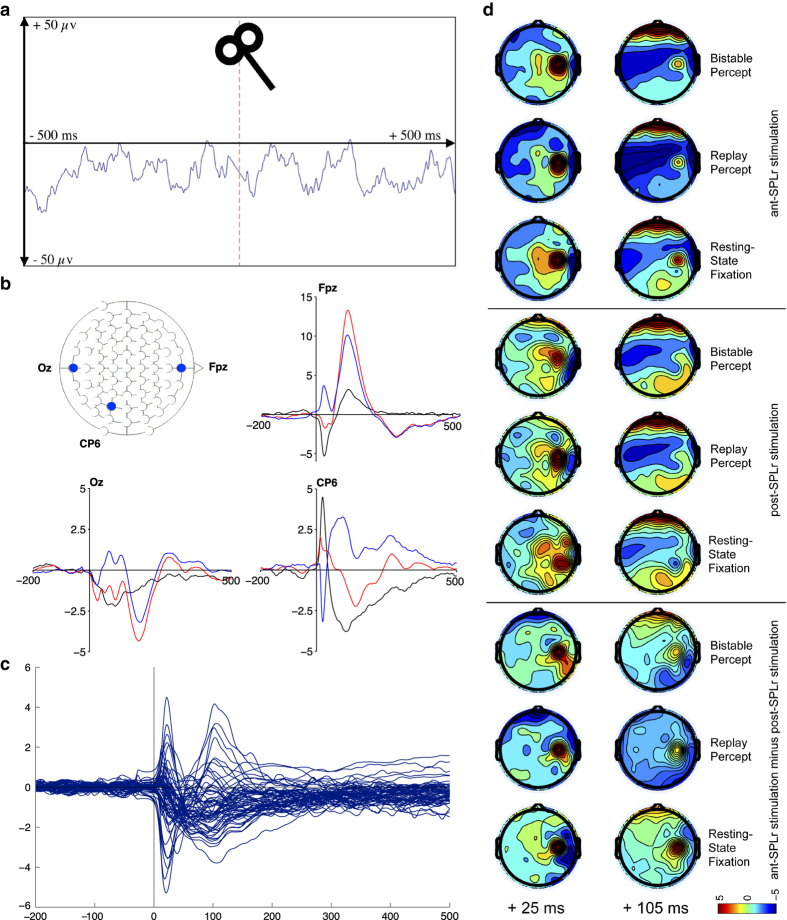
Figure 3. TMS effect on the EEG recording.
(a) TMS artefact correction. EEG recording of the Pz electrode around a TMS pulse after TMS artefact correction. Single trial in a representative participant. Red line indicates the moment of TMS stimulation. (b) TMS-evoked potentials. Baseline-corrected grand average TMS-evoked potentials for electrodes Oz, CP6 and Fpz for the bistable percept stimulus when ant-SPLr is stimulated (red), post-SPLr is stimulated (blue) as well as the difference wave between the two (black). x=time in ms. y=voltage in μv. Electrodes within the 10–20 system top-left. (c) Butterly plot. Difference wave butterfly plot of all electrodes apart from C4, CP4, eye and mastoid electrodes contrasting ant-SPLr minus post-SPLr for bistable perception. x=time in ms. y=voltage in μv. (d) Scalp maps. Topographic scalp maps of absolute voltage from −5 to +5 μv at 25 and 105 ms post TMS divided by the six experimental conditions (stimulus 1, 2 or 3×TMS site ant-SPLr or post-SPLr) as well as for the three stimuli when post-SPLr amplitudes are subtracted from ant-SPLr amplitudes, prior to any spatial filtering. Colour scale depicts voltage in μv.

