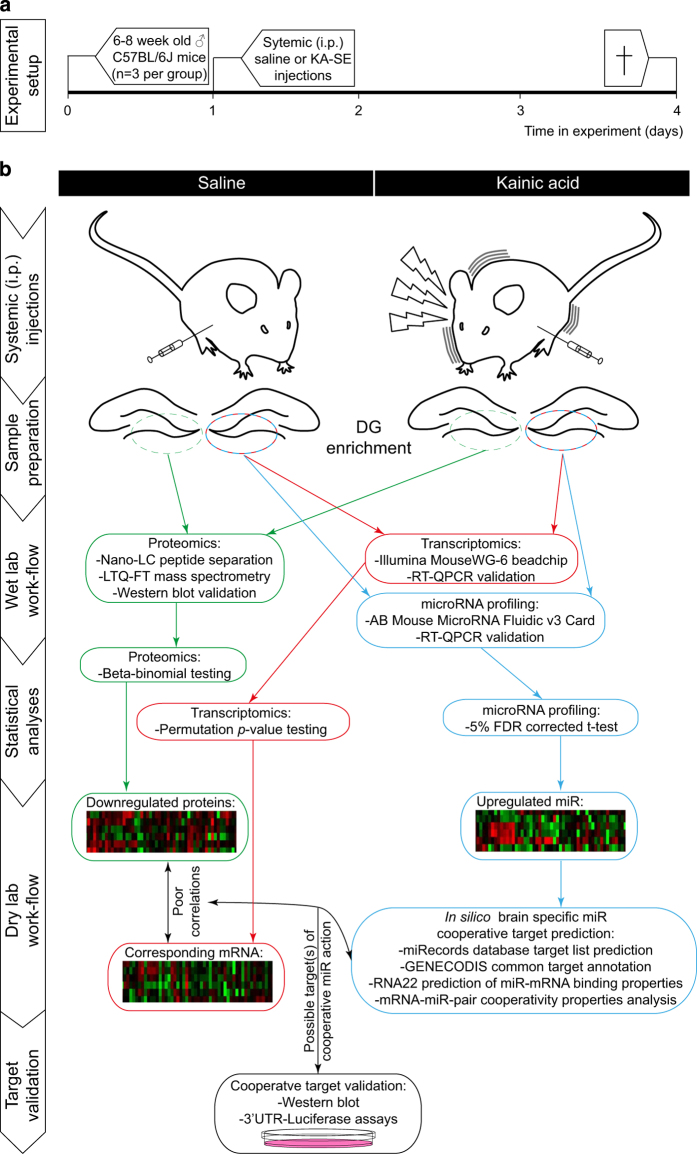
Figure 1. Schematic depiction of the experimental setup and subsequent workflow used to obtaining multi-omics data of DG tissue, 3 day after KA-SE.
(a) Schematic illustration showing the timeline of experimental procedures on the animals. (b) Illustration on the experimental procedures, sample preparation, wet-lab workflow and statistical analysis steps carried out to produce proteomics, transcriptomics and microRNA profiles 3 days after KA-SE in the DG. The dry-lab workflow and target validation procedures are examples of how this data set was used by Schouten et al.14 to identify molecular mechanisms underlying alterations in NSPC apoptosis following KA-SE, yet not further discussed here.

