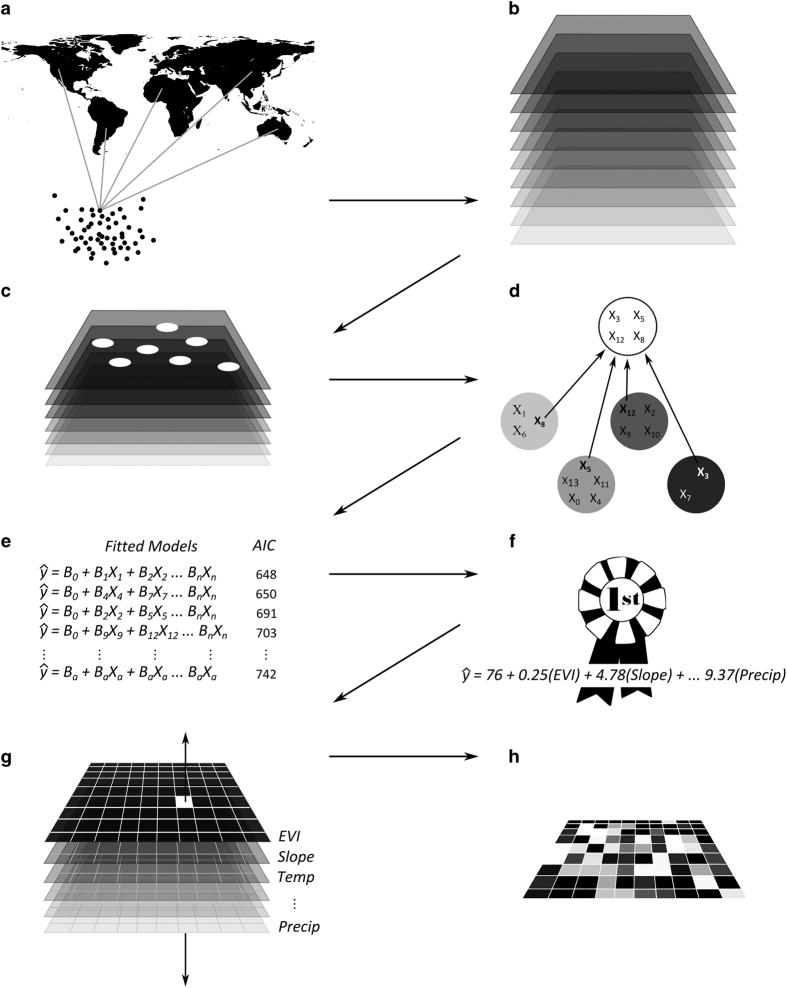
Figure 1. A conceptual model of our analytical process.
(a) We amassed over 420,000 forest inventory plot records from every continent except Antarctica. (b) We acquired and unified an initial pool of four-dozen spatial covariates to use in model development. (c) We selected a subset of spatial covariates, extracted their values at field plot locations, and bound these values to the plot records. (d) For each of 14 biomes we subjected the enhanced plot records to hierarchical (agglomerative) clustering to identify the least collinear collection of covariates. (e) Generalized linear models were fit to every possible combination of clustered covariates. (f) A top ranking predictive model was selected or created through model averaging. (g) Each biome’s top ranking model was applied in a pixel-level map algebraic framework. (h) We scaled a penultimate spatial model of tree density using land cover data to arrive at our final predictions.

