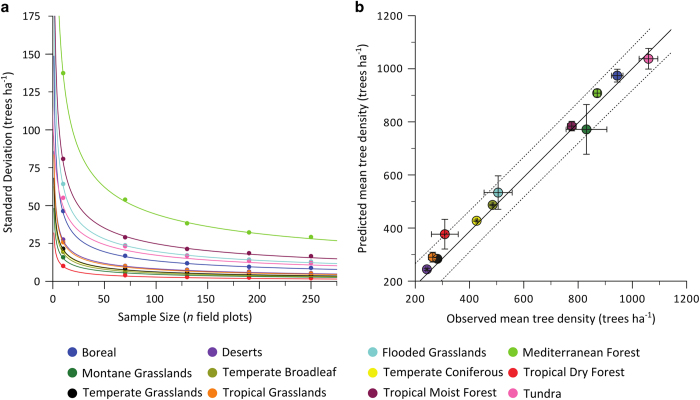
Figure 2. Statistical and spatial model validation.
(a) The standard deviation of the predicted mean number of trees per biome as a function of sample size. As sample size increases, the variability of the predicted mean tree density reaches a threshold, beyond which an increase in sample size results in a minimal increase in precision. Standard deviations were calculated using a bootstrapping approach (see Statistical model validation), and smooth curves were modeled using standard linear regression with a log–log transformation. After Crowther et al (2015) Fig. 3b. (b) Biome-level regression models predict the mean values of the omitted validation plot measurements in 12 biomes. Overall, the models underestimated mean tree density by ~3% (slope=0.97) but this difference was not statistically significant (P=0.51). Bars show±one s.d. for the predicted mean and the dotted boundaries represent the 95% confidence interval for the mean. The values plotted here represent mean densities for the plot measurements (that is, for forested ecosystems), rather than those predicted for each entire biome. Figure is modified from Crowther et al (2015) Fig. 3a.

