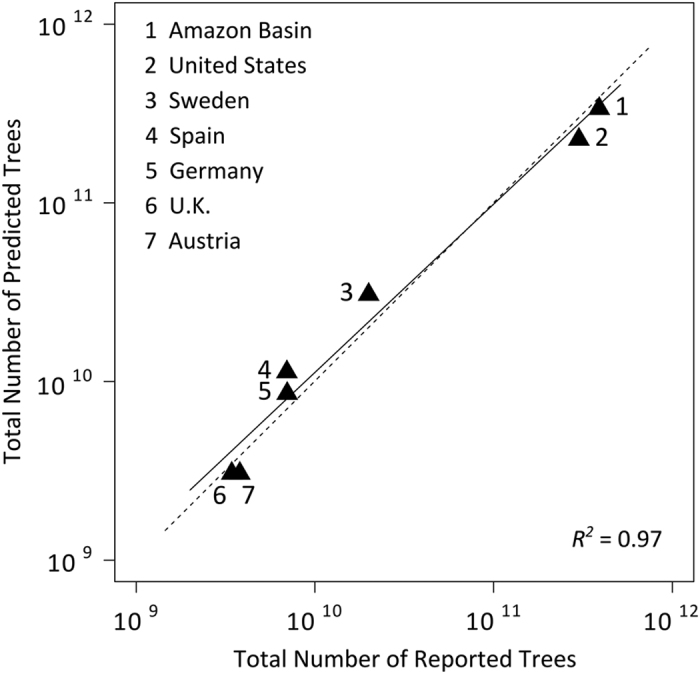
Figure 4. Correlation of predicted and published numbers of trees per country.

The dotted line is a 1:1 line, while the solid line is the ordinary least squares line of best fit. Figure is modified from Crowther et al (2015) Fig. 4d.

The dotted line is a 1:1 line, while the solid line is the ordinary least squares line of best fit. Figure is modified from Crowther et al (2015) Fig. 4d.