
Fig. 7.
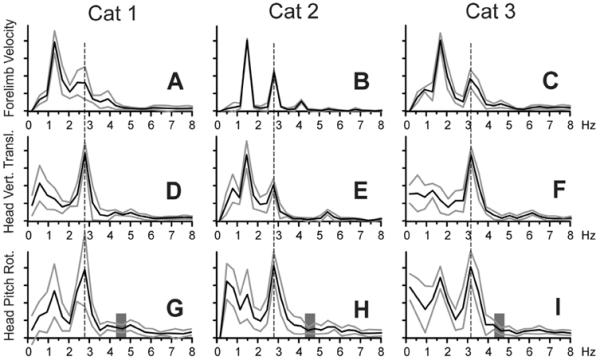
Fourier power spectra (mean±SD) of the forelimb forward velocity (A–C), the head vertical translation (D–F), and pitch rotation (G–I) for each cat. The dominant frequency of head pitch rotation is indicated with a vertical dashed line. Values for frequencies above 8 Hz were very small and are not shown. (G–I) Vertical gray bars highlight the range of resonant frequencies for the head. Other designations as in Fig. 4.