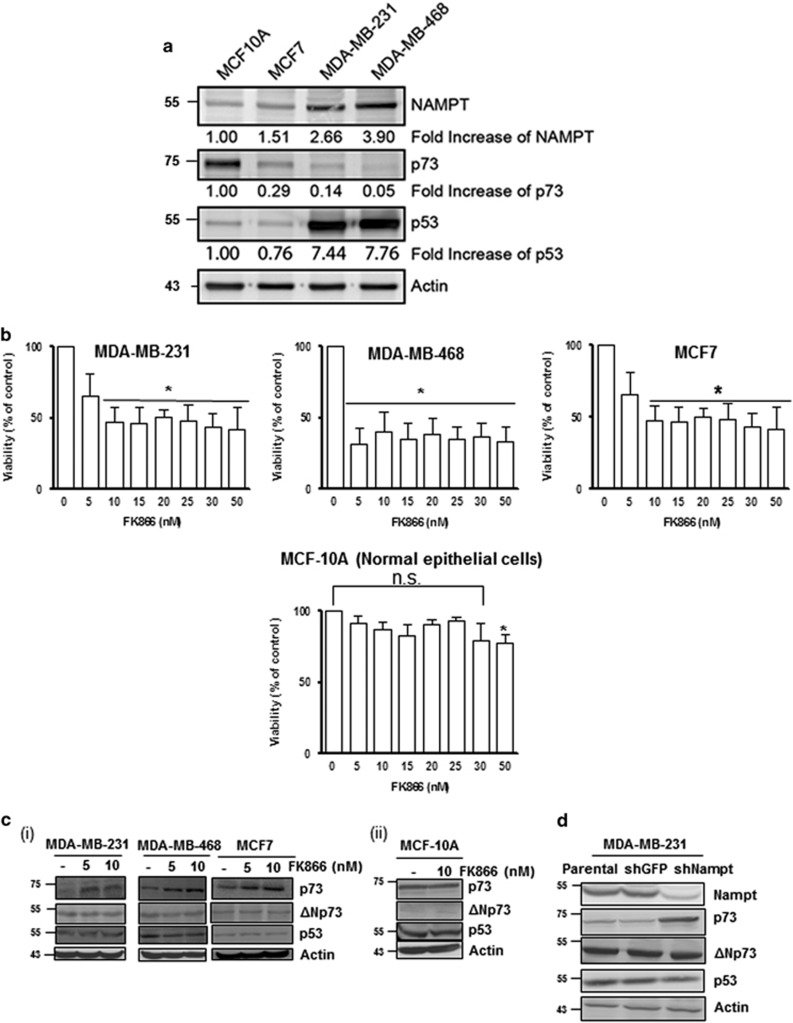
Figure 7.
Inverse relationship between NAMPT and p73 levels in breast cancer cell lines. (a) Comparison of the basal levels of NAMPT in breast cancer cell lines (MCF-7, MDA-MB-231 and MDA-MB-468) and the normal, non-transformed cell line MCF-10A. (b) The above cell lines were exposed to FK866 for 24 h and analysed for cell count. Results represent three independent experiments; *P-values ⩽0.05 compared with the control. (c) Western blot analysis showing the effect of FK866 treatment (48 h) on p73 and ΔNp73 expression in breast cancer cells (i) and non-transformed cells (ii). (d) Effect of NAMPT KD on p73 levels in MDA-MB-231 cells. NS, nonsignificant

