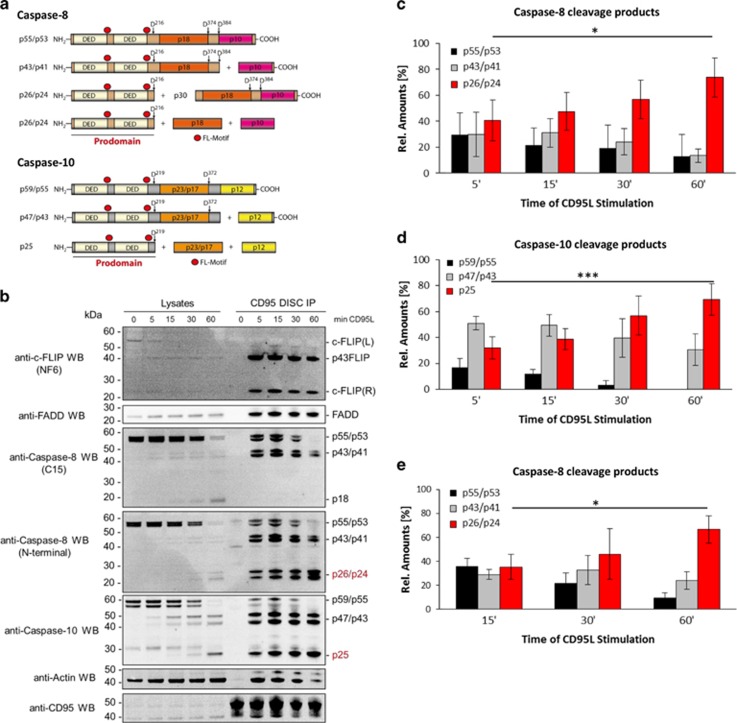
Figure 1.
Kinetics of procaspase-8/-10 cleavage products at the DISC. (a) Schematic representation of procaspase-8 and -10. (b) SKW6.4 cells were stimulated with 1000 ng/ml CD95L for indicated periods of time. CD95 DISC IPs were analyzed using western blot and probed for the indicated proteins. Band intensities of the cleavage products of procaspase-8 and -10 at the DISC were quantified using ImageJ. The amount of each cleavage product for procaspase-8 or -10 was measured in relation to the total amounts of procaspase-8 or -10, respectively. (c) Distribution of procaspase-8 cleavage products measured by quantitative western blot. To determine the distribution of the cleavage products for procaspase-8, the band intensities for the procaspase-8 and its cleavage products at the DISC-IP, i.e., p55/53, p43/p41 and p26/p24, were quantified and divided by the sum of the intensities of all procaspase-8 proteins. The mean±S.D. is shown (n=4). (d) Distribution of procaspase-10 cleavage products measured by quantitative western blot. The mean±S.D. is shown (n=5). (e) Distribution of procaspase-8 cleavage products measured by quantitative mass spectrometry. To determine the distribution of the cleavage products for procaspase-8, the peak areas at the mass spectrometry spectrum for the procaspase-8 and its different cleavage products at the DISC-IP were quantified and divided by the sum of the amounts of all procaspase-8 proteins as in the quantifications using western blot. The mean±S.D. is shown (n=3). Statistical significance: *P<0.05, ***P<0.001

