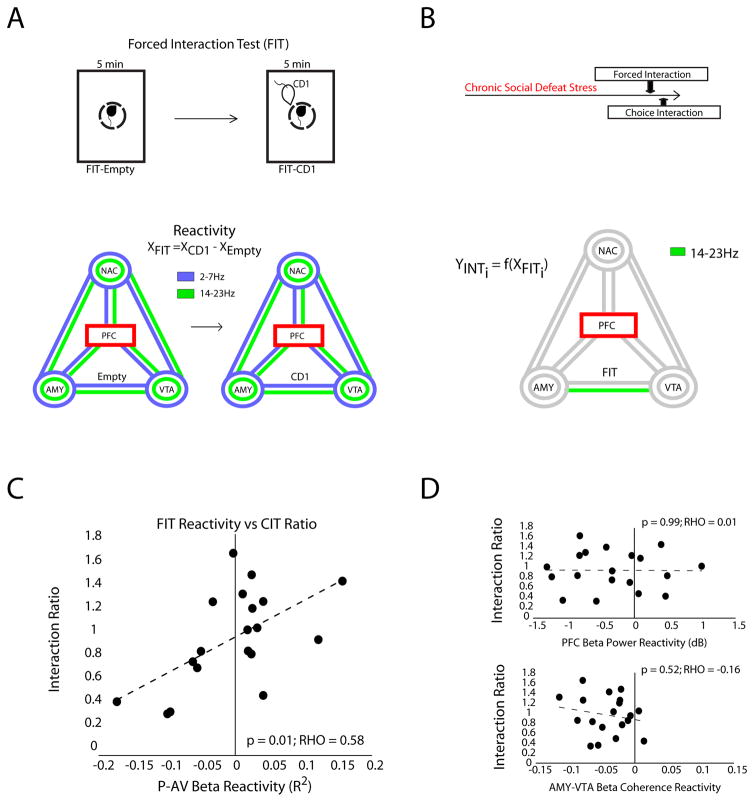
Figure 3. PFC-centered network dynamics signal stress susceptibility.
A) The PFC-centered forced interaction test (FIT) reactivity was compared to the choice interaction ratio using the Elastic network. The PFC seed plot shows the 18 model parameters used for analysis (3 power measures shown as circles and 6 coherence measures shown as lines for each of the two PFC-dependent frequencies bands). B) Only the PFC beta (14–23 Hz) power vs. AMY-VTA beta coherence correlation was retained in the model. C) The correlation between these values is shown below (p=0.01 using Spearman rank correlation; bottom). D) The mean PFC beta power and mean AMY-VTA beta coherence were calculated for each segment of the FIT, and the reactivity of each measure was compared to the choice interaction test ratio using a Spearman rank regression. There was no significant relationship between behavioral responses and either brain measure.

