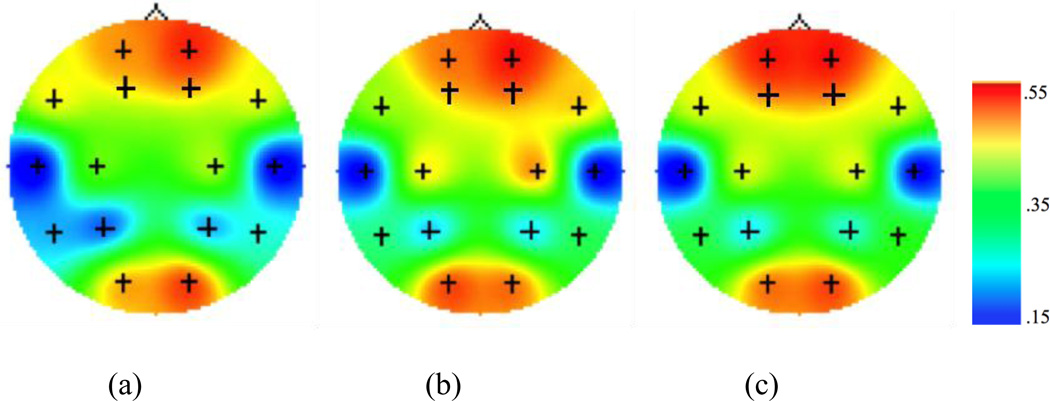
Figure 2.
Topographic maps for EEG coherence values within the theta band during (a) encoding, (b) recency, and (c) recognition conditions of the episodic memory task. Figures depict coherence between F3/F4 electrodes with all other channels within the same hemisphere. Higher values (i.e. warm colors) represent greater coherence.

