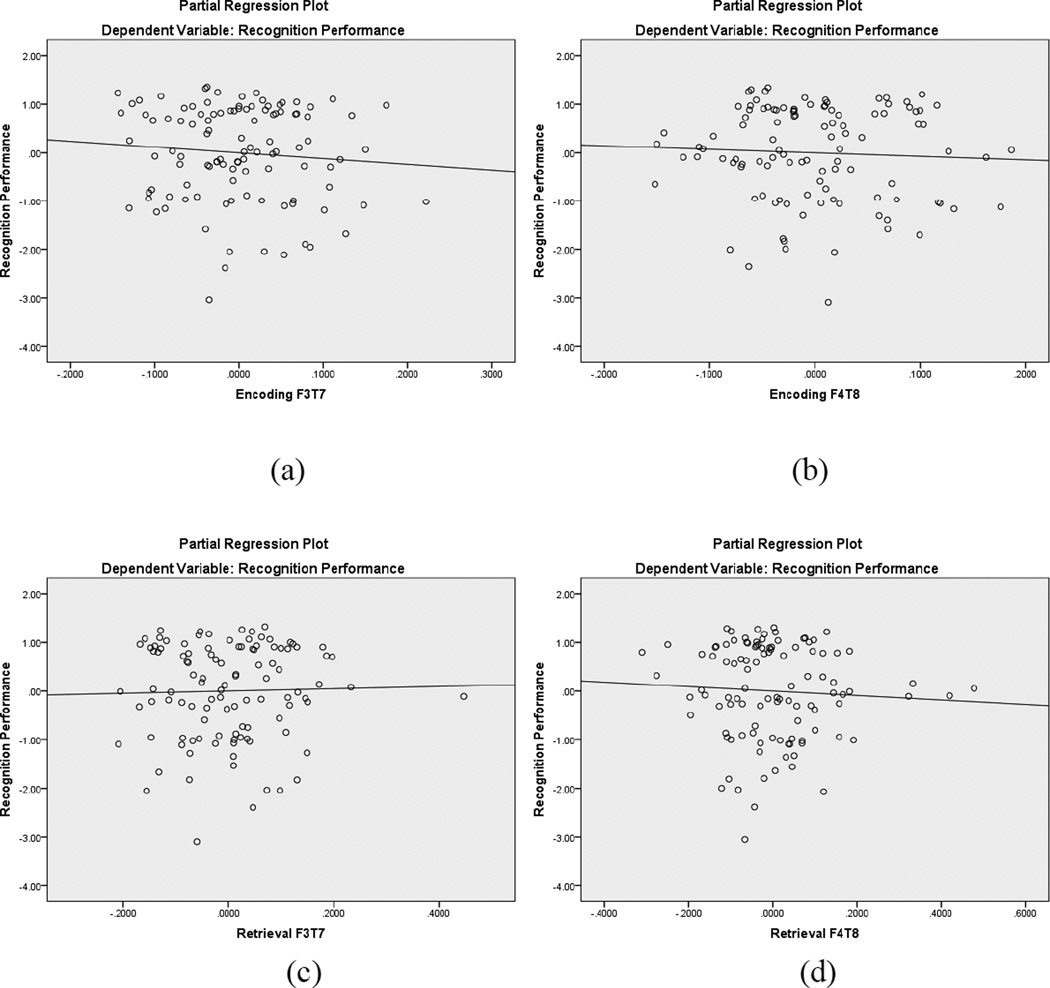
Figure 7.
Partial regression plots for recognition frontotemporal EEG coherence within the alpha band. The top plots are during encoding (a, b) and the bottom plots are during retrieval (c, d). In each pair of plots, the left image represents left hemisphere coherence and the right image represents right hemisphere coherence. None of the regression lines were significant.

