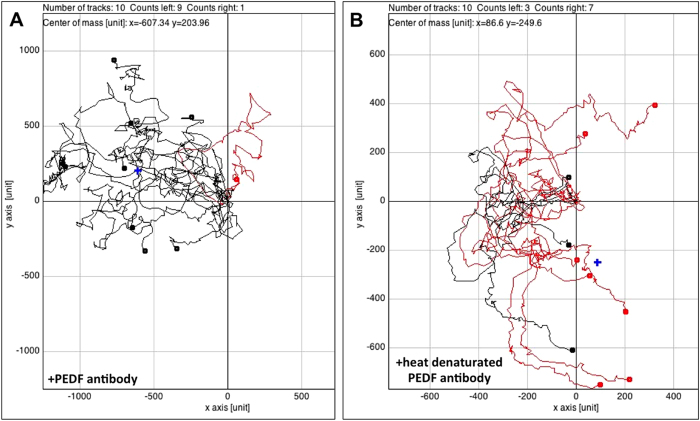
Figure 3. HTPCs via secreted PEDF influence the migration behaviour of HUVECs.
Time-lapse movies (see Supplement 2 for movies) covering a 48 h period of co-culture (HTPCs and HUVECs) experiments were recorded and corresponding migration plots were generated (A,B). Experiments were repeated three times. The migration behaviour of randomly chosen HUVECs (n = 10) were tracked and are indicated by colour marks. Lines show migration tracks and endpoints (dots). Red tracks indicate cells, which migrated to the right and black tracks indicate cells migrating to the left hand side, i.e. towards the gap separating HUVECs and HTPCs at time of seeding. A blue cross symbolizes the centre of mass (corresponding to the area occupied by the majority of cells) in each migration plot. (A) The analysis of a co-culture experiment with HTPCs and HUVECs incubated in media containing 1.5 μg/ml of a specific antibody recognizing PEDF showed a directional movement of 9 tracked HUVECs towards the gap and the HTPCs. One single cell ends its track on the right hand side (red line). The centre of mass is thus shifted to the left hand side (x = −607.34; y = 203.96). (B) Analysis of an experiment, in which 1.5 μg/ml of the same PEDF antibody as in A was present. However, it was heat-inactivated by boiling for 30 minutes at 95 °C. The endpoints of 7 HUVECs are located to the right and 3 to the left. The centre of mass is close to the starting point (x = 86.6; y = −249.6).

