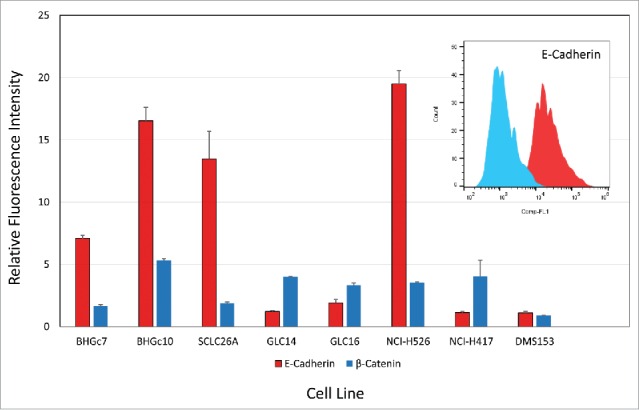
Figure 3.

Flow cytometric analysis of E-cadherin and β-catenin expression. CTCs and cell lines were stained in indirect immunofluorescence for E-cadherin and β-catenin and values are presented as ratios of specific fluorescence signals with antibody to isotype controls (mean values of fluorescence maxima ± SD).
