Figure 8.
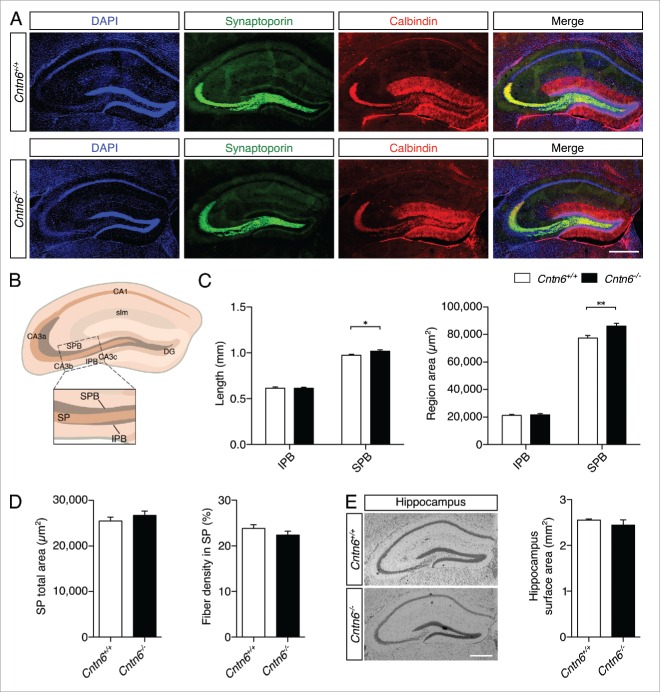
Hippocampal mossy fiber distribution in Cntn6-deficient mice. (A) Representative image of synaptoporin (green) and calbindin (red) expression in adult wild-type and Cntn6−/− mice. DAPI is in blue. The scale bars represent 250 μm. (B) Schematic representation of the adult mouse hippocampus. The rectangle indicates the area and location used for quantification of mossy fiber crossings in the SP of the CA3. Abbreviations: CA1, cornu ammonis 1; CA3a-c, cornu ammonis 3a-c; DG, dentate gyrus; SPB, suprapyramidal bundle; IPB, infrapyramidal pundle; SP, stratum pyramidale; slm, stratum lacunosum-moleculare. (C) Quantification of the length (left panel) and area size (right panel) of the IPB and SPB in wild-type and Cntn6−/− mice only showed a significant increase of both parameters on the SPB. (D) Quantification of total area size (left panel) and percentage of mossy fibers crossing the SP (right panel) did not reveal a difference between wild-type and Cntn6−/− mice. Analysis was performed on at least three sections per brain from wild-type and Cntn6−/− adult mice (n = 7 per genotype) using unpaired Student's t test and one-way ANOVA. Data are presented as mean ±SEM. *, p < 0.05, **, p < 0.01. (E) Nissl-stained sections of adult wild-type and Cntn6−/− mice did not demonstrate a difference in hippocampal surface areas between genotypes. Analysis was performed on at least two sections per brain from wild-type and Cntn6−/− adult mice (n = 5 per genotype) using unpaired Student's t test and one-way ANOVA. Data are presented as mean ±SEM.

