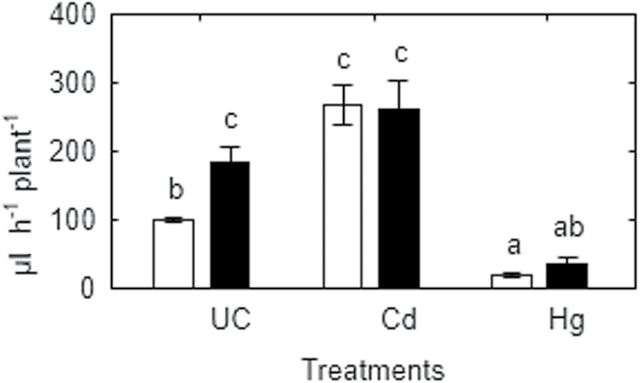
Fig. 8.
Absolute root sap flow rate of SGE (open bars) and SGECdt (filled bars) pea genotypes after 1h exposure to 50 μM CdCl2 (Cd), 50 μM HgCl2 (Hg) or untreated controls (UC). Different letters show significant differences between treatments (LSD test; P<0.05). Means of two experiments with at least four determinations.

