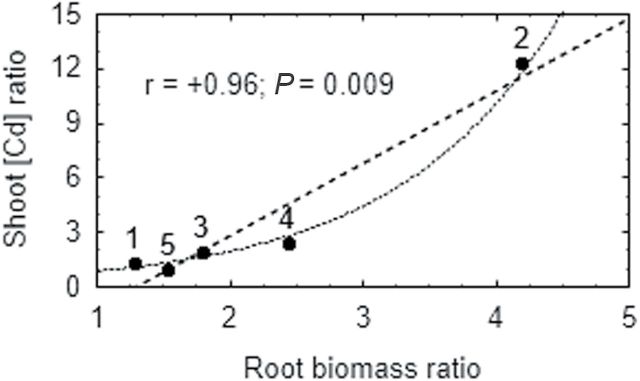
Fig. 9.
Pooled data on relationship between the effect of cadmium on genotypic differences (SGECdt/SGE ratio) in root biomass and shoot cadmium concentration. Black points show experimental data with cadmium concentrations in nutrient solution and reference: 1, 1 μM CdCl2 (this study); 2, 4 μM CdCl2 (this study); 3, 2.5 μM CdCl2 (Tsyganov et al., 2004); 4, 3 μM CdCl2 (Tsyganov et al., 2007); 5, 4 μM CdCl2 (Malkov et al., 2007). Dash and dotted lines show linear and exponential fitting, respectively.

