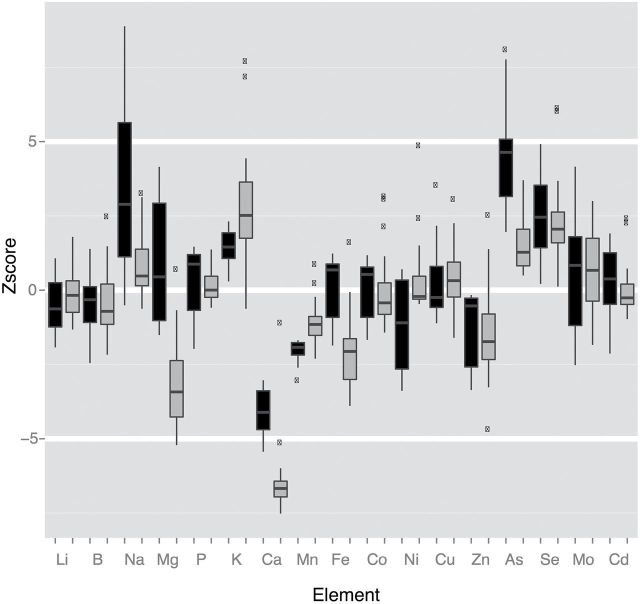
Fig. 1.
Multi-element phenotype for the esb1-2 mutant. Boxplots showing the distributions of Z-scores (number of standard deviations from the Col-0 mean) from trays 1095 (black) and 1146 (grey) at www.ionomicshub.org (last accessed: 15 December 2014). Note that Na, K, Ca, Mn, Zn, As, and Se are different in both trays, while Mg and Fe are only different in tray 1146.

