Fig. 2.

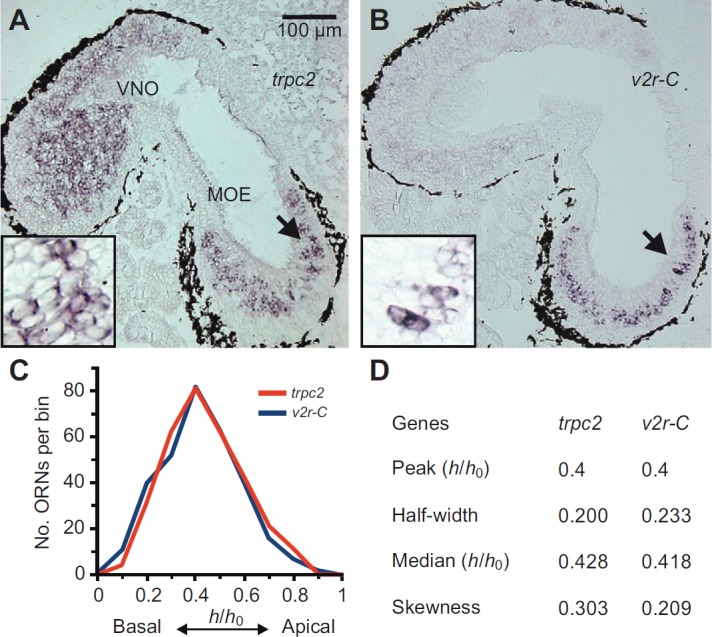
Distribution of trpc2-positive cells closely mimics that of v2r-C-expressing cells in the MOE. (A) Cryosections of larval Xenopus laevis were hybridized with antisense probes for the trpc2 gene. The micrograph shown is from a horizontal section of larval head tissue, which contains both the MOE and the VNO. A zone of trpc2-positive cells was detected in the MOE and widespread labeling was visible in the VNO. The arrow is pointing at the region enlarged in the inset. (B) Cryosections of larval head tissue were hybridized with antisense probes for the v2r-C gene. Orientation and region as explained in A. Consistent with previous results (see Syed et al., 2013), v2r-C-positive cells were only found in the MOE, and occupy a discrete zone there. The arrow is pointing at the region enlarged in the inset. (C) Basal-to-apical distribution (0, most basal; 1, most apical position) of trpc2 (314 cells, 5 sections) and v2r-C-expressing cells [data taken from Syed et al. (Syed et al., 2013) and shown here for comparison]. Data are given as mid-bin values (0.1 bin size); y-axis shows total number of cells per bin. (D) Characteristic parameters for the distribution of trpc2-expressing cells; values for v2r-C taken from our earlier work (Syed et al., 2013) are shown for comparison.
