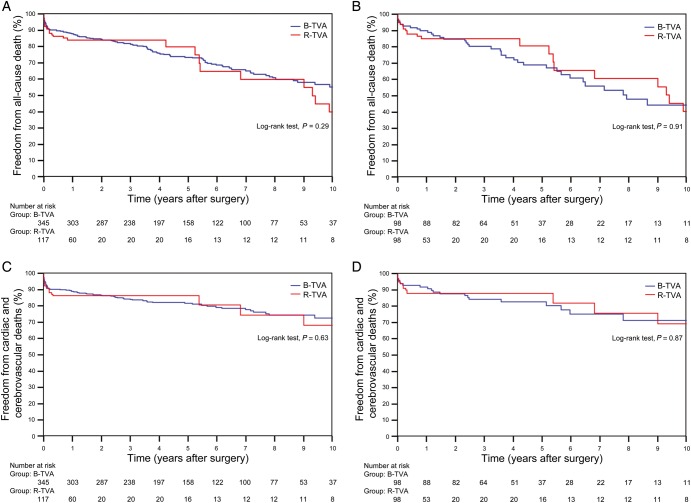
Figure 2:
Non-parametric curves (Kaplan–Meier model) of freedom from (A and B) all-cause death (including hospital mortality) and (C and D) cardiac and cerebrovascular deaths (including hospital mortality). (A and C) The overall series: in B-TVA patients, the 1-, 5- and 10-year non-parametric estimates of freedom from all-cause death were 87.8 (95% CI: 86–89.6), 73.4 (95% CI: 70.9–75.9) and 55.2% (95% CI: 51.3–59.1), respectively, and the 1-, 5- and 10-year non-parametric estimates of freedom from cardiac and cerebrovascular deaths were 89 (95% CI: 87.3–90.7), 81.5 (95% CI: 79.3–83.2) and 72.6% (95% CI: 69.2–76), respectively; in R-TVA patients, the 1-, 5- and 10-year non-parametric estimates of freedom from all-cause death were 84 (95% CI: 80.5–87.5), 79.8 (95% CI: 74.5–85.1) and 39.9% (95% CI: 29.6–50.2), respectively, and the 1-, 5- and 10-year non-parametric estimates of freedom from cardiac and cerebrovascular deaths were 86.3 (95% CI: 83.1–89.5), 80.5 (95% CI: 74.2–86.8) and 68.1% (95% CI: 58.4–77.8), respectively. (B and D) The PS-matched pairs. The number of patients remaining at risk is reported. B-TVA: tricuspid valve annuloplasty with flexible band; PS: propensity score; R-TVA: tricuspid valve annuloplasty with rigid ring.

