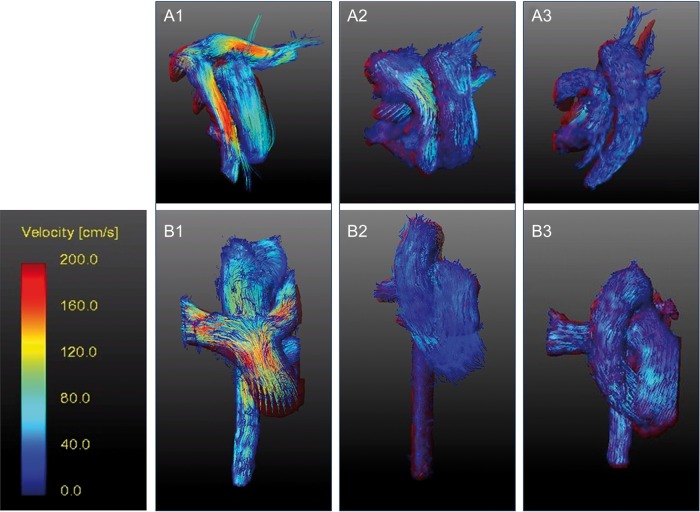
Figure 3:
Colour-coded flow velocities in the great arteries displayed from different perspectives (superior view: 1a–3a; anterior view: 1b–3b). Pathlines were reconstructed from 4D flow data for patients after ASO with Lecompte (left), spiral anastomosis (middle) and a healthy volunteer (right). ASO: arterial switch operation.

