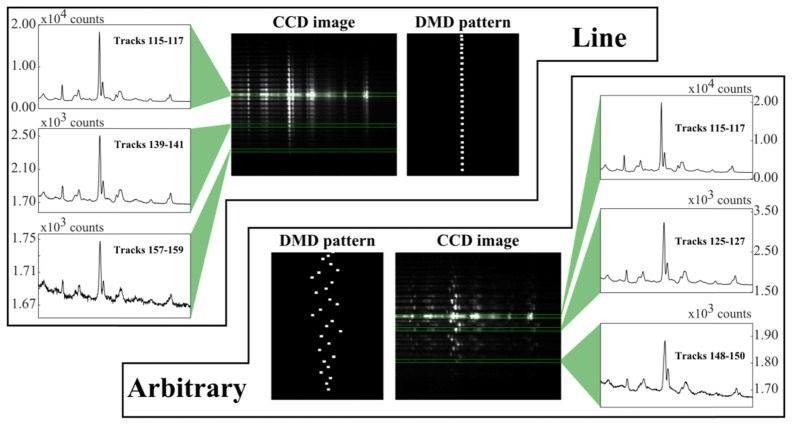
Fig. 3.
Homogeneity of multiplexed spectra on a uniform polystyrene substrate for line and arbitrary sampling patterns. CCD images (cropped, resized, and intensity-scaled for clarity) show Raman fingerprint region for line and arbitrary placement of spots, with selected spectra (the most intense corresponding to the 0th order/optic axis for each setup). Total laser power: 2.6W before LC-SLM; integration time: 1 second.

