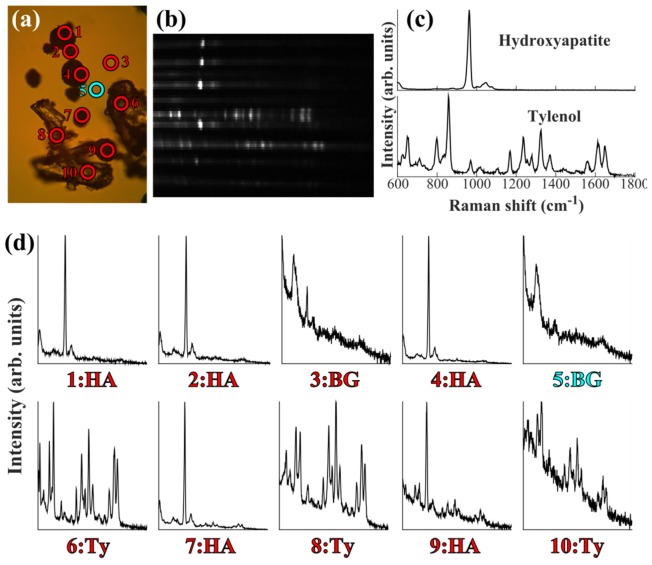
Fig. 4.
Multifocal Raman spectra of a mixed sample consisting of Tylenol and hydroxyapatite powder on a quartz coverslip (micrograph shown in (a)). Sampling points selected manually. Cropped CCD image of the multiplexed spectra (b), reference spectra (c) and the corresponding spectral plots from the labelled sampling points (BG: background, Ty: tylenol, HA: hydroxyapatite) (d). Laser power at sample: ~1W; integration time: 2 seconds.

