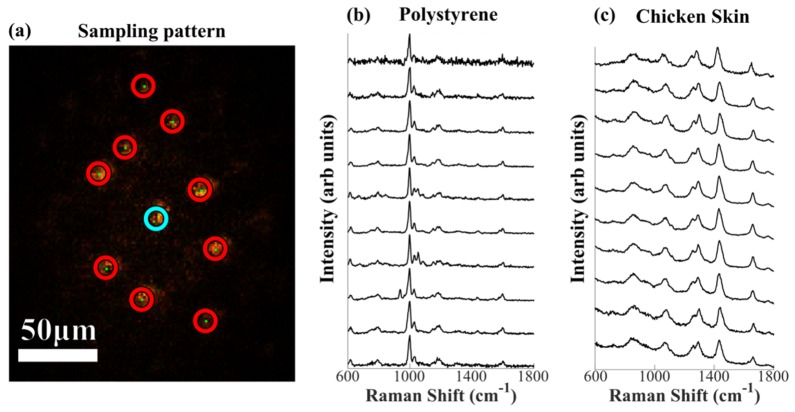
Fig. 5.
Multiplexed Raman spectra with an optimized blazing function based on 10 beams with total laser power ~1W at sample. Sampling positions selected manually. (a) Microscope camera image of sampling pattern (on polystyrene). (b) Uniform polystyrene film sample (acquisition time 0.1 s); (c) Chicken skin sample, acquisition time 2 seconds. Spectra plotted from binning two CCD tracks from raw image data with no additional processing. In (b) and (c) spectra are shifted vertically for clarity.

