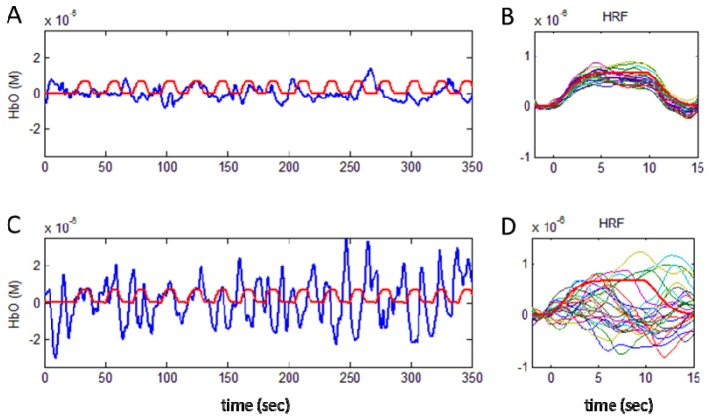
Fig. 2.
Examples of small and large amplitude Mayer waves in the HbO time course are shown by the blue lines in (A) and (C) respectively. The synthetic HRF is indicated by the red lines. The hemodynamic response function recovered for 25 different stimulus paradigms are shown in (B) and (D) for the small and large amplitude Mayer waves respectively. Note that results are shown for HRF estimation after introducing a signal change of 1% from baseline for the 690 nm and 2% for 830 nm in the raw NIRS data (case 1).

