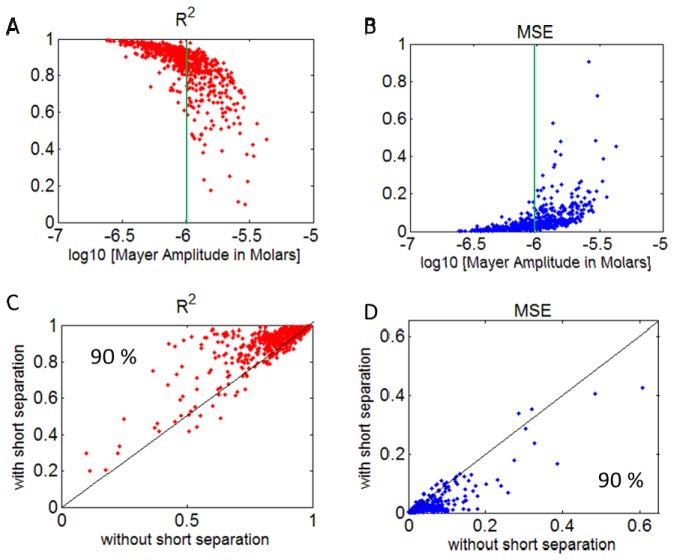
Fig. 3.
R2 (A) and normalized MSE (B) vs. Mayer wave amplitude (in Molars) in HbO signal for all runs. Comparison of R2 (C) and absolute MSE (D) obtained using GLM with and without short separation regression. Percentages in the lower panels indicate the percent of data points above/below the midline indicating that short separation regression improved the estimation. The vertical green line shows the median value for the observed Mayer wave amplitude. Note that results are shown for HRF estimation after introducing a signal change of 1% from baseline for the 690 nm and 2% for 830 nm in the raw NIRS data (case 1).

