
Fig. 5.
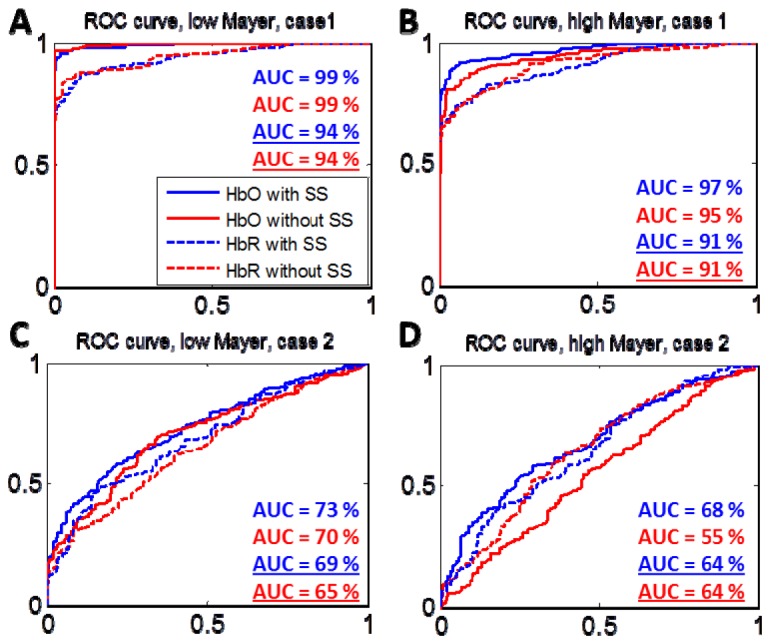
Receiver Operating Characteristic (ROC) Curves obtained for the estimation of the HRF at low and high Mayer wave power with and without short separation regression for case 1 (Panels A and B) and case 2 (Panels C and D). Solid lines are for HbO estimation and dashed lines are for HbR estimation. The AUC for the ROC curves are shown with and without underline for the HbO and HbR estimations respectively.