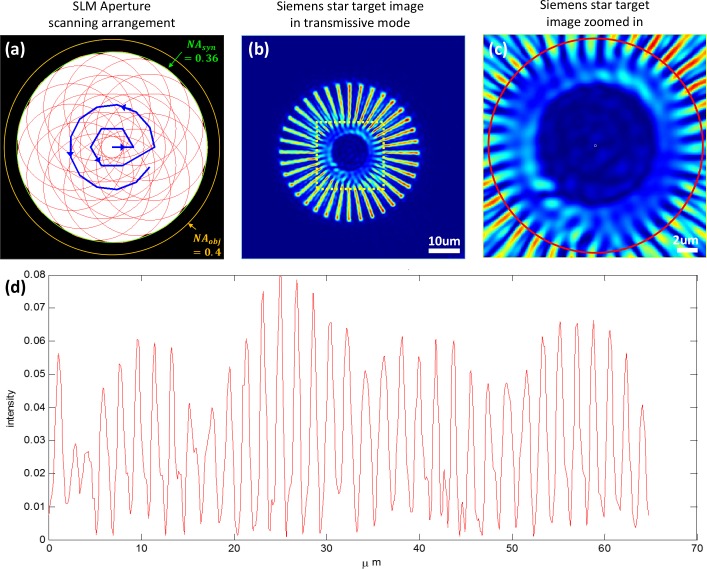
Fig. 2.
(a) The arrangement of aperture scanning sequence on the SLM plane. A circular aperture is scanned following the blue trajectory. The covered area provides a synthesized NA of 0.36, which is within the objective NA of 0.4. (b–c) Siemens star target intensity image in transmissive mode ASFPM. (d)intensity distribution of the red circle in (c), showing a resolution of 1.8 μm which matches the theoretical resolution of the synthesized NA.

