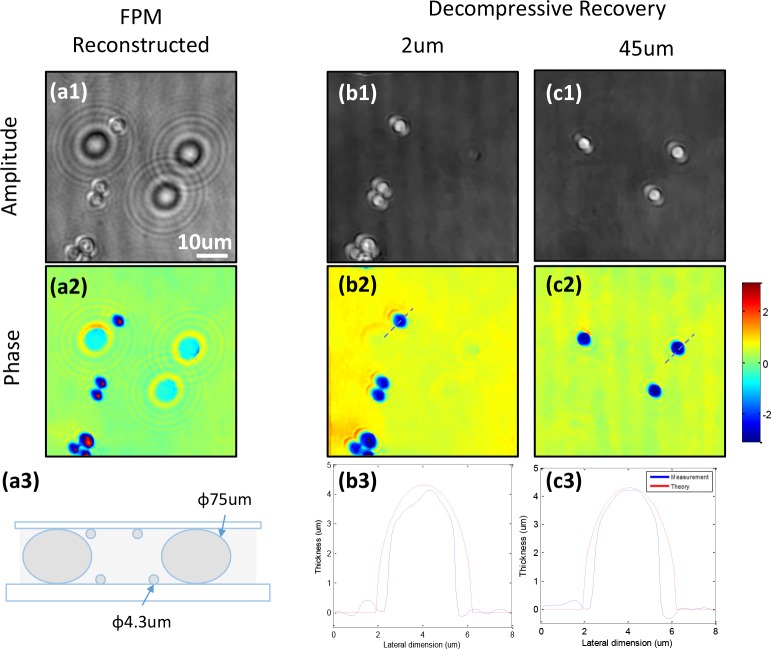
Fig. 7.
Decompressive recovery of a microsphere sample. (a1–a2) Reconstructed amplitude and phase information of the sample using ASFPM. (a3) Two-layer sample configuration. (b–c) Amplitude and phase from decompressive recovery at (b1–b2) 2μm and (c1–c2) 45μm focal planes. (b3) and (c3) are the thickness profiles of microsphere calculated from the recovered phase through the two lines in (b2) and (c2), shown in blue. The red lines show the theoretical thickness value of the 4.3μm microsphere.

