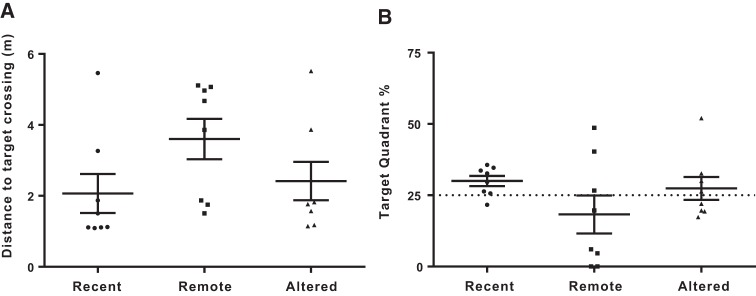
Figure 2.
Graphs are plotted as individual data points with their respective group mean ± SEM. (A) Distance travelled to cross the former hidden-platform/target location during the retention test (probe trial) for each group. Swim distances did not differ across groups (P = 0.19) and were comparable to those observed on the final trials of acquisition training, suggesting that the platform location was remembered. (B) Percent time spent swimming in the target quadrant for each group. The dotted line represents chance values (25%). Only the Recent group showed a preference for the target quadrant that was significantly above chance (Recent P < 0.025; Remote P = 0.345; Altered P = 0.564), suggesting that retention was not as strong in the Remote and Altered groups.

