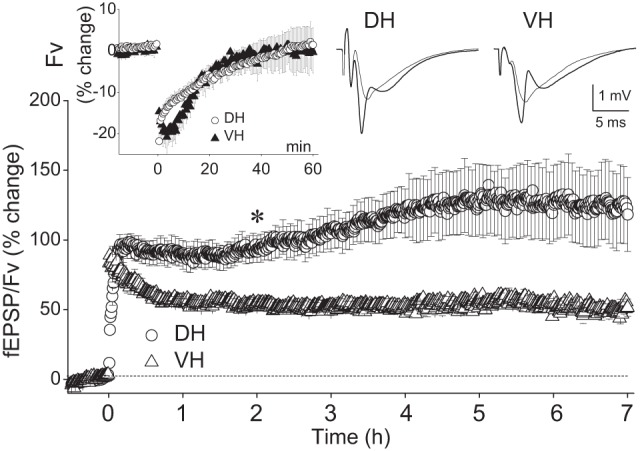
Figure 1.

VH compared with DH displays lower LTP amplitude but similar ability to sustain nondecremental LTP. In the main diagram the fEPSP/Fv ratio is plotted as a function of time, one point per 30 sec (S.E.M. are shown in one every five points, for clarity). DH and VH data were collected from 12 and nine animals, respectively. Each animal contributed with a single slice. The magnitude of LTP of fEPSP/Fv was significantly higher in the DH than that in the VH at every hour post-tetanus (Mann–Whitney U test at each hour, P < 0.05). In addition, the LTP was enhanced in the DH but not in the VH during the recording period. The asterisk indicates the beginning of significant LTP enhancement in the DH; the potentiation reached a plateau at the 5 h (for statistics, see main text). Representative recordings before (thin line traces) and 7 h (thick line traces) after the delivery of HFS are shown at the top right of the plot. Note that the immediate post-tetanic potentiation (i.e., during the first minutes after the delivery of HFS) was higher in the VH than that in the DH. The time courses of the HFS-induced changes in the fiber volley (Fv) during the 60 min post-tetanus are shown in the inset. Fv was transiently depressed in both hippocampal poles similarly.
