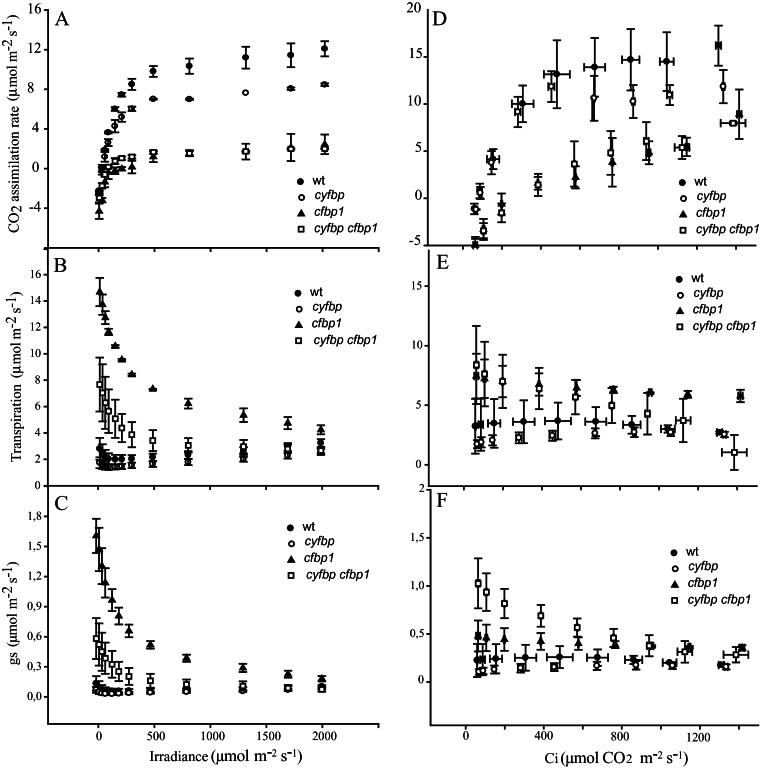
Fig. 7.
Photosynthetic capacity of the wild type (wt) and cyfbp, cpfbp1, and cyfbp cpfbp1 mutants. Plants were grown in a controlled growth cabinet under 100 μmol m–2 s–1 light regimes for 20 d. Photosynthetic carbon fixation rates were determined in the newest fully expanded leaf, as a function of increasing irradiance (A) at saturating CO2 (400 μmol mol–1; A/Q response curve) and as a function of increasing CO2 concentration (D) at saturating light levels (1000 μmol m–2 s–1; A/C i response curve). Transpiration (E) and stomatal conductance (g s) were determined in the same leaves (B, E and C, F). Values represent the mean of eight plants ±SE.

