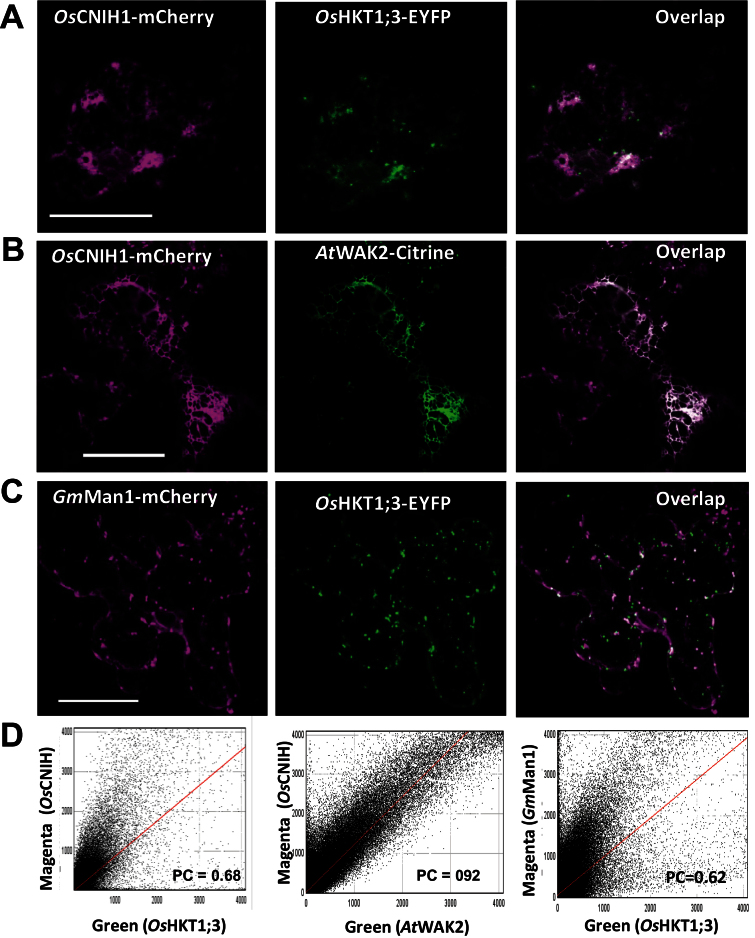
Fig. 4.
Intracellular co-localization of OsCNIH1 with OsHKT1;3 in plants. (A) Expression of OsCNIH1–mCherry (left) and OsHKT1;3–EYFP (centre), and co-localization of the two proteins (right) in tobacco leaves. (B) Expression of OsCNIH1–mCherry (left) and the ER marker AtWAK2–Citrine (centre), and co-localization of the two proteins (right). (C) Expression of OsHKT1;3–EYFP (centre) and the Golgi marker GmMan1–mCherry (left), and co-localization of the two proteins (right). (D) Scatter plots of pixel distribution of the magenta (y-axis) and green (y-axis) channels employing the Costes algorithm for images shown in (A, left), (B, centre), and (C, right). Scale bar=25 μm.

