Fig. 7.
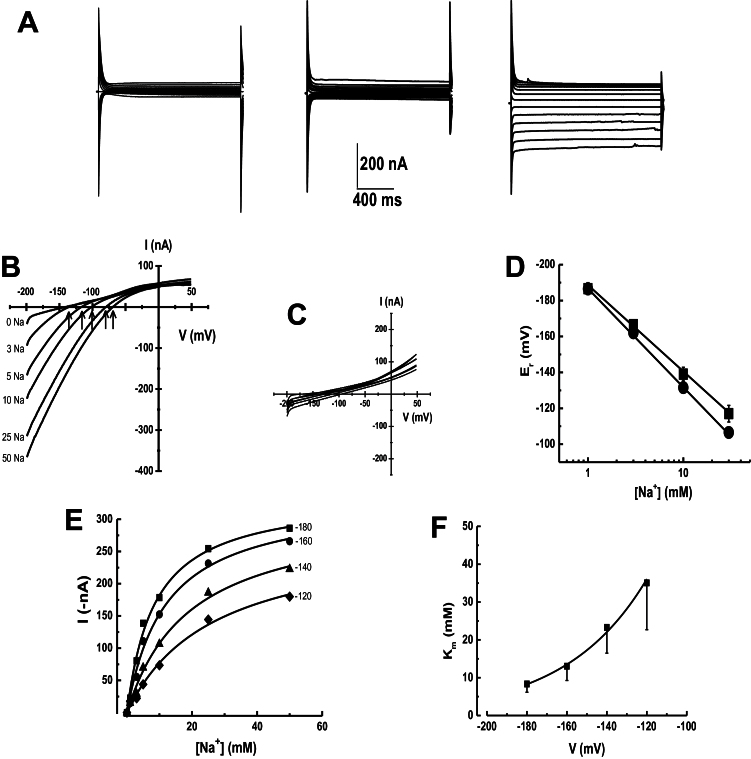
Transport properties of OsHKT1;3. (A) Original traces of currents activated by voltage pulses between –200 mV and 50 mV in 20 mV steps from a control water-injected oocyte exposed to 30mM NaCl (left), or expressing OsHKT1;3 exposed to the bath solution either without (centre) or with 30mM NaCl (right). (B) I–V plot from currents recorded in an oocyte expressing OsHKT1;3 and exposed to different concentrations of NaCl (mM); E r (arrows). (C) I–V plot from currents recorded from a control oocyte and exposed to the same NaCl solutions as in (B). (D) Plot showing the linear relationship between E r and extracellular Na+ concentrations from oocytes expressing OsHKT1;3 in the absence (circles) or presence of 1mM KCl (squares). Lines are least square linear regressions fits with a slope of 54.2 mV per decade. (E) Sodium transport kinetics were voltage dependent. Lines are fits to the Michaelis–Menten equation at the corresponding voltages with r 2 ≥0.9. (F) The affinity (K m) of OsHKT1;3 for Na+ was voltage dependent. The line is a fit to Equation 1. Data are from more than five oocytes from 3–4 different frogs and correspond to the mean ±SD.

