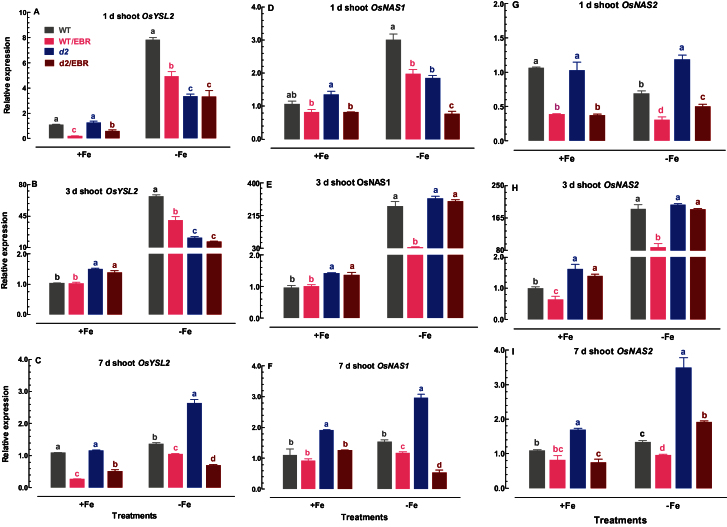
Fig. 8.
Time-course quantitative RT-PCR analysis of OsYSL2, OsNAS1, and OsNAS2 in shoots: Effect of EBR on OsYSL2 expression in shoots of WT and d2-1 plants under +Fe and –Fe conditions. Data are means ± SE of three biological replicates. Means with different letters are significantly different within the same Fe treatment (P ≤ 0.05). (This figure is available in colour at JXB online)

