Fig. 3.
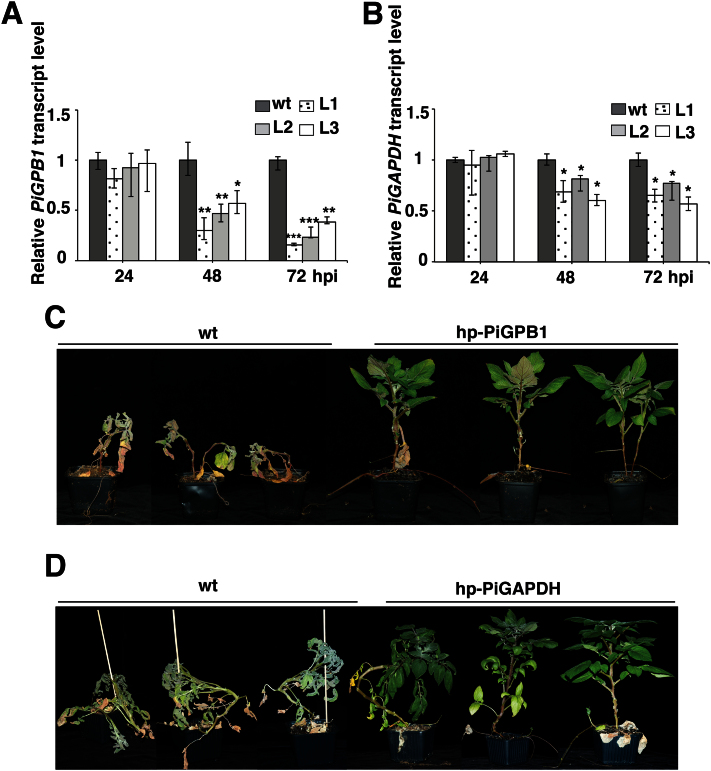
Analysis of transgenic potato harbouring a hp-PiGPB1 or hp-PiGAPDH construct. (A) Transcript abundance of the PiGPB1 in wild-type and three lines of hp-PiGPB1 plants. (B) Transcript abundance of the PiGAPDH gene in wild-type and hp-PiGAPDH plants inoculated with P. infestans at 24, 48, and 72 hpi quantified by qRT-PCR. Data are normalized to P. infestans actinA mRNA levels and represent means ±SE (n=3 pooled leaves of 3 plants). Asterisks indicate significant difference to the wild type (Student’s t test; *P <0.05: **P <0.01; ***P <0.001). Overall performance of (C) wild-type and hp-PiGPB1 transgenic plants, and (D) wild-type and hp-PiGAPDH transgenic plants at 30 dpi.

