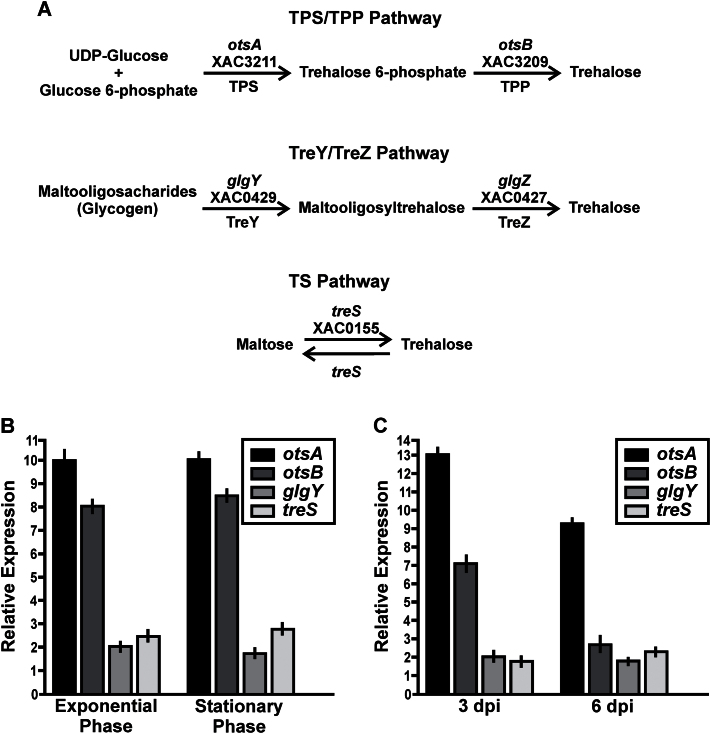
Fig. 1.
Analysis of the expression levels of otsA, ostB, glgY, and TS in XccWT by RT-qPCR assays. (A) Representation of trehalose biosynthetic pathways found in Xcc. The annotations of the enzymes in the Xcc genome are shown above the arrows. (B) RT-qPCR of XccWT RNA extracted from exponential-phase and stationary-phase cultures grown in XVM2. Bars indicate the expression levels of the genes at both growth phases in XVM2 medium relative to the expression levels in NB rich medium. Values are the means of four biological replicates with three technical replicates each. Error bars indicate standard deviation. (C) RT-qPCR of XccWT RNA obtained from bacteria present in infected citrus leaves at 0, 3, and 6 dpi. Bars indicate the expression levels of the genes at 3 and 6 dpi relative to the expression levels at time 0. Values are the means of four biological replicates with three technical replicates each. Error bars indicate standard deviation. Results were analysed by Student t-test (P<0.05) and one-way ANOVA (P<0.05).

