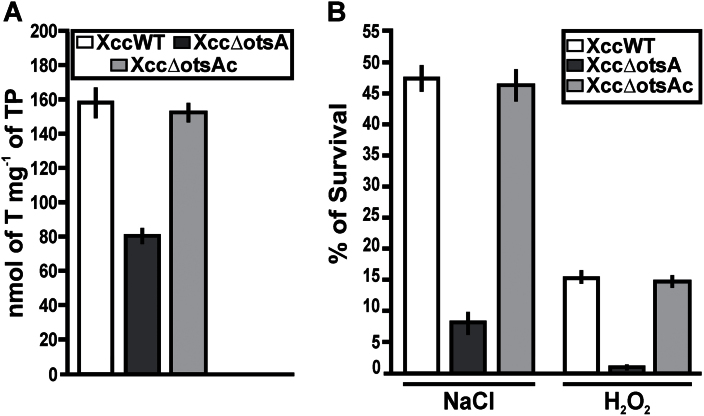
Fig. 2.
Quantification of trehalose and survival under salt and oxidative stress in the XccWT, Xcc∆otsA, and Xcc∆otsAc strains. (A) Trehalose content was quantified in the strains grown to the stationary phase in XVM2 medium. Bars indicate the nmol of trehalose (T) per mg of total protein (TP) of the bacterial pellets assayed. Values are the means of four cultures of each strain. Error bars indicate the standard deviation. (B) The cfu ml–1 of the strains in XVM2 medium without and in the presence of 300mM NaCl or 30mM H2O2 were calculated. Bars indicate the percentage survival under stress conditions relative to XVM2 medium. Values are the means of three independent experiments. Error bars indicate the standard deviation. The data were analysed for statistical differences by one-way ANOVA (P<0.05).

